
Pump energy depends on where the pump operates on its system curve, so screening starts with measured flow, head, and power, then tests speed control with the affinity laws.
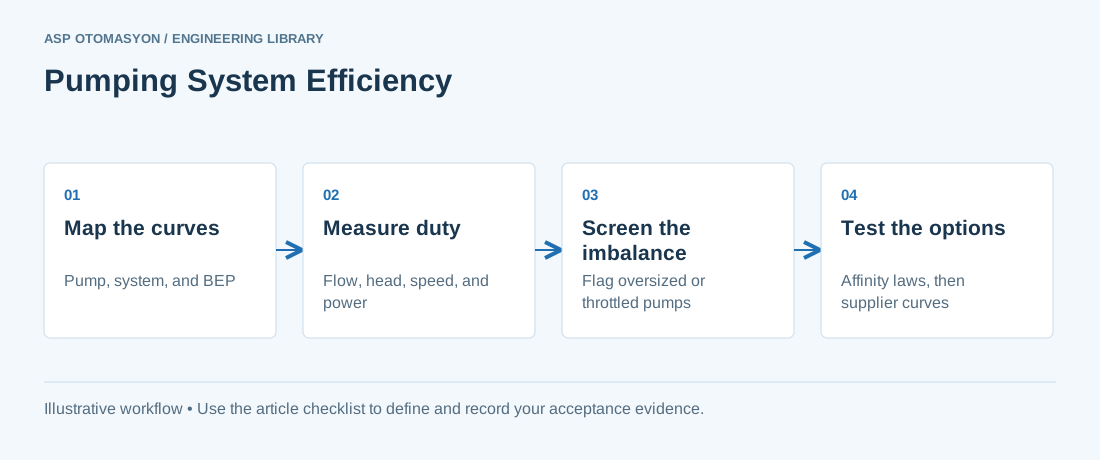
Pumps often run far from the duty they were chosen for. The pump was sized for a maximum or a future demand, the process now needs less flow, and a throttle valve or bypass line absorbs the difference. The result is wasted power, extra wear, and a pump that is harder to maintain. This article explains how to read pump and system curves, what the affinity laws predict and where they fail, and how to screen a pumping system for savings.
The method applies to centrifugal pumps in water, process, cooling, and utility service. It is a screening method. A final design, a drive selection, or a motor change needs supplier curves and measured data. Motor efficiency is covered in IE4 and IE5 motor efficiency, and drive selection in variable frequency drives for energy efficiency.
Pump curve, system curve, and the operating point
A pump curve shows the head a pump develops at each flow, along with its efficiency and shaft power at those flows. A system curve shows the head the piping and equipment need at each flow: static head, such as a lift or pressure difference, plus friction losses that rise with the square of flow. The operating point is where the two curves cross.
Changing the operating point means changing one of the curves. The system curve changes with valve position, piping, or bypass lines. The pump curve changes with speed, impeller diameter, or the pump itself. Each change needs a different check, so write down which curve a proposal moves.
Every centrifugal pump has a best efficiency point (BEP). At the BEP, efficiency is highest and radial bearing loads are lowest. The DOE sourcebook describes the BEP as the point where a pump operates most cost-effectively in terms of energy and maintenance.
Oversizing and throttling: the energy and life cost
Oversizing wastes energy in a less visible way than a valve does. A pump chosen for a peak or future demand may run far from its BEP for much of its life, and the process is then held in shape by valves. The DOE tip sheet states that most pumps are oversized and rarely run at their design capacity.
Throttling adds resistance to bring the flow down to the required level. The extra head is paid for in pump energy, and the pump moves along its curve away from BEP, so efficiency falls. A bypass line does something similar: it returns flow to suction, so the pump spends power moving water that does no process work.
The affinity laws and where they fail
For a centrifugal pump with little or no static head, the affinity laws predict performance at a new speed from performance at the current speed. Flow changes in direct proportion to speed, head changes with the square of speed, and shaft power changes with the cube of speed. The DOE tip sheet states these relations and notes that reducing speed by 20 percent can cut input power by about half.
The laws fail when static head is significant. A pump lifting to a tank at fixed height must overcome that height at any speed, so head does not fall with the square of speed. In that case the new operating point must be found by drawing the system curve, which the DOE tip sheet calls essential.
The laws also assume constant efficiency and leave out drive and motor losses. Treat them as a first estimate, then confirm the new operating point on the supplier's curve.
Control options compared
The table compares common ways to match a pump to a changing demand. The right choice depends on static head, how often demand changes, and whether the pump is permanently oversized.
| Method | Energy behavior | Good fit | Watch for |
|---|---|---|---|
| Throttling valve | Pump runs at full speed; the valve absorbs extra head and efficiency falls | Short-term trims on a fixed-speed pump | Wasted energy, valve wear, noise |
| Bypass or recirculation line | Part of the flow returns to suction while the pump still draws full power | Protection against low-flow or surge conditions | Energy spent on flow that does no process work; fix the cause first |
| Variable speed drive | Power falls steeply with speed; the cube law applies only when static head is small | Varying demand in systems with low static head | Drive and motor losses; minimum speed set by the pump supplier |
| Impeller trim or replacement | Permanently reduces head and power at fixed speed | A pump that is oversized for a stable duty | Irreversible; confirm the new curve with the supplier |
| Multiple pumps with staging | Keeps each running pump nearer its BEP as demand changes | Wide demand swings or high static head | Depends on pump and system curves; check the staging logic |
Screening procedure and measurement needs
Screening needs measured values, not nameplate values. Measure flow, discharge and suction pressure (to derive head), speed, and electrical power to the motor, then estimate shaft power with the motor efficiency. Record the process demand the pump must meet. This is a pump-level version of an industrial energy audit.
- Survey every pump in the system, and list its duty, speed, control method, and any bypass or throttle position.
- Measure flow, head, speed, and power at normal operating conditions, and record the calibration date of each instrument.
- Calculate the imbalance between measured and required flow and head. The DOE tip sheet flags imbalances above 20 percent, and flows 30 percent or more away from BEP, for further analysis.
- For each flagged pump, decide whether static head is small enough for the affinity laws, or whether the system curve must be drawn first.
- Estimate the saving for each option from measured operating hours and load profile, then compare it with the cost and risk of the change. Track the result as specific energy consumption in kWh per unit pumped.
Worked example: speed reduction against throttling
The example compares two ways to deliver a lower flow from the same pump. The affinity laws give an ideal estimate, so the result is a ceiling, not a forecast.
Reliability effects of operating far from BEP
The reliability case can be as strong as the energy case. The DOE sourcebook notes that operation away from BEP can accelerate wear in bearings and mechanical seals, and that most pump bearings have a design life that depends on the cube of the load. Lowering speed at low flow moves the operating point toward lower bearing load, while throttling a pump at full speed can raise load and wear.
Before and after any change, record vibration and bearing temperature under the same operating conditions. Predictive maintenance with vibration analysis gives the method for trending that data.
The DOE sourcebook lists five common signs that a pump is oversized. Look for them before collecting data:
- Excessive flow noise
- Highly throttled flow control valves
- Heavy use of bypass lines
- Frequent bearing and seal replacement
- Intermittent pump operation
Apply this to your project
- Pump and system curves are on file, with the duty point and the BEP range marked.
- Flow, head, speed, and power were measured at normal operation, with calibration dates recorded.
- Static head was determined before the affinity laws were applied.
- Each proposed change states its expected effect on operating point, efficiency, and bearing or seal life.
- Savings are verified after the change under comparable operating conditions.
- Vibration and bearing temperature were recorded before and after the change.
Follow an ASP project guide to connect the fundamentals with implementation and acceptance.
Frequently asked questions
Can I use the affinity laws to size a new pump?
Not as the main method. The affinity laws predict how an installed pump changes with speed, and they assume little static head and constant efficiency. Sizing a new pump requires the supplier's curves and the system curve at the design duty. Use the laws to estimate the effect of a speed change on an installed pump, then confirm the new point on the supplier's curve before buying a drive.
Is a variable speed drive always the best way to save pump energy?
No. A drive saves most where demand varies and static head is small, because power falls steeply with speed. With high static head, the saving is smaller than the cube law suggests and must be checked on the system curve. A drive also adds losses and needs a minimum speed set by the pump supplier. Compare options on measured operating hours and load profile, not on nameplate data.
What is the best efficiency point and why does it matter?
The best efficiency point (BEP) is the flow at which a pump's efficiency is highest for a given impeller and speed. At BEP, radial bearing loads are also lowest. Operating far from BEP lowers efficiency and can shorten bearing and seal life. The DOE sourcebook describes BEP as the point where a pump operates most cost-effectively in terms of energy and maintenance.
How can I tell if a pump is oversized?
Look for the signs in the DOE sourcebook: excessive flow noise, highly throttled control valves, heavy bypass use, frequent bearing and seal replacement, and intermittent operation. Then measure flow and head at normal duty and compare them with the required duty. The DOE tip sheet uses an imbalance above 20 percent, or flow 30 percent or more away from BEP, as a trigger for detailed review, not as proof of a fault.
Continue the engineering work
- Variable Frequency Drives for Energy Efficiency
- IE4 and IE5 Motors: High-Efficiency Motor Selection and Management
- Industrial Energy Audit Methodology (ISO 50002)
- Energy Benchmarking with Specific Energy Consumption (SEC)
- Predictive Maintenance with Vibration Analysis
Browse the related technical library or follow an ASP project guide to plan the implementation sequence.
Primary references and further reading
Use the original specifications and product documentation for implementation details. Examples in this guide are illustrative engineering scenarios, not published project results.
- U.S. Department of Energy — Improving Pumping System Performance: A Sourcebook for Industry, Second Edition (PDF)
- U.S. Department of Energy — Pump Systems resource page
- U.S. Department of Energy — Tip Sheet 11, Adjustable Speed Pumping Applications (PDF)
- U.S. Department of Energy — Tip Sheet 6, Match Pumps to System Requirements (PDF)
- Hydraulic Institute — Pumps.org standards and pump system resources