
Two sites can report the same OEE and mean different things, so a standard vocabulary, formulas, and time model must be fixed before any comparison is made.
Two plants can report the same OEE and mean different things by it. One counts planned breaks as planned production time and the other does not. One counts minor stops as downtime and the other treats them as speed loss. Standard KPI definitions remove that ambiguity. ISO 22400 is the ISO standard series on key performance indicators (KPIs) for manufacturing operations management. Its Part 2 specifies a selected set of KPIs in practical use, each with its formula and elements, time behavior, and unit, so that results from different sites and systems share one meaning.
This article explains what such a standard is for, the KPIs most plants start with and how they fit together, the time model that drives every calculation, the data a PLC and MES must supply, and a rollout approach. It does not reproduce the text of ISO 22400, which is a purchased publication. The exact names, formulas, and time categories must be taken from the edition your site applies, including its amendment. Where this article shows formulas, they are the widely used OEE forms, given to explain structure.
What a KPI standard is for
A KPI standard fixes the vocabulary and calculation rules for operations measures, so that a number from one site means the same as a number from another. It does not decide which KPIs a plant should track or what targets to set. Those are management decisions. The standard supplies the definitions that the decisions depend on.
The KPIs sit in the operations layer described by ISA-95. ISA-95, also published as IEC 62264, defines an abstract model of the enterprise and the data exchange between control functions and other enterprise functions. ISO 22400-2 places its KPIs at level 3, manufacturing operations management, uses generic terms such as work center and work unit, and refers to IEC 62264 for the equipment model. A KPI therefore needs the same data context: which equipment, which order, which state, and which time window.
The core KPIs and how they relate
Most manufacturing KPIs reduce to a few building blocks: the time the equipment was available, the speed it ran compared with its ideal, and the share of output that was good. OEE combines these three into one composite. The table gives the general forms used in practice. Confirm each name and formula against the standard before you publish it.
| KPI | What it tells you | General form (confirm against the standard) |
|---|---|---|
| Availability | Share of planned time the equipment was operating | Operating time divided by planned production time |
| Performance | How close the run speed was to the ideal cycle | Ideal cycle time times total count, divided by operating time |
| Quality rate | Share of output that met the quality requirement | Good count divided by total count |
| OEE | Composite of availability, performance, and quality | Availability times performance times quality rate |
| Throughput | Good output per unit of time | Good count divided by a stated time window |
| Utilization | Share of the time basis spent in a productive state | Depends on the time model; define the categories as the standard does |
The time model decides the number
Every KPI in this family starts from a time model: a fixed set of categories that assigns each minute of the calendar to one state. Most disagreements between sites come from this step rather than from the arithmetic. Settle four questions first: which time is planned production time, what counts as a planned stop, whether a minor stop is availability loss or speed loss, and how changeovers and start-up are classified.
- Planned production time: the time the site has planned to run. Decide whether planned breaks and planned maintenance windows sit inside or outside it.
- Operating time: planned production time minus the stops that count as availability loss.
- Ideal cycle time: the engineering value used for performance. Record its source, because it is an assumption rather than a measurement.
- Good count: output that meets the quality requirement, counted at a defined point in the process.
Data a PLC and MES must supply
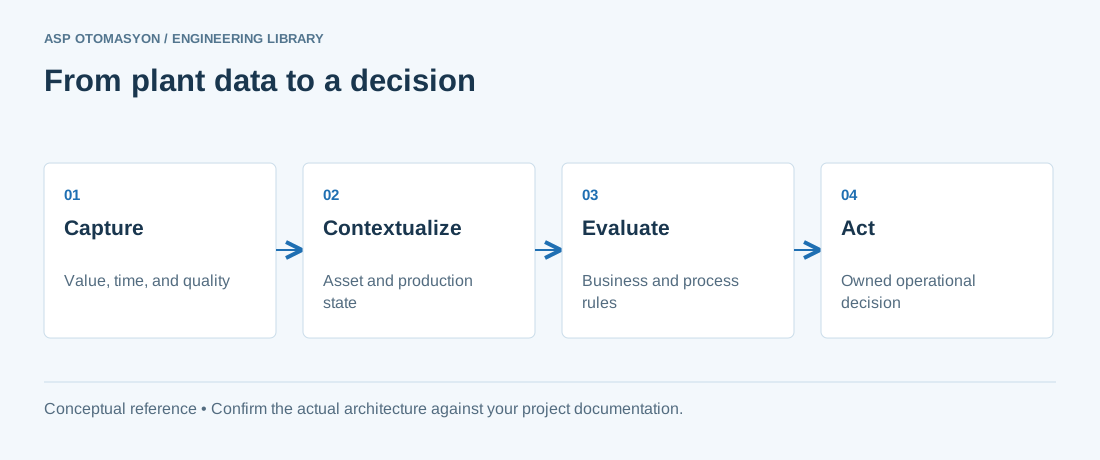
A KPI is only as sound as its data. The PLC normally supplies machine states, count or cycle signals, and timestamps. The MES supplies order context, the good and rejected classification, and the reason codes for stops. Both systems must share a time base. The OPC UA information model should carry the definition, unit, and time basis of each KPI value, as covered in OPC UA information model design. The OPC Foundation online reference describes the specifications that support such models.
- Define the state signals. List each machine state, its source tag, and the rule that sets it. States must not overlap.
- Define the count point. State where the good and total counts are taken, and whether rejects found after that point are counted.
- Define the stop reasons. Use a fixed list of reason codes with a named owner, as described in MES downtime reason codes.
- Check the clock. Confirm that PLC and MES timestamps share a time base, and record the tolerance you accept.
Comparing sites and rolling out the definitions
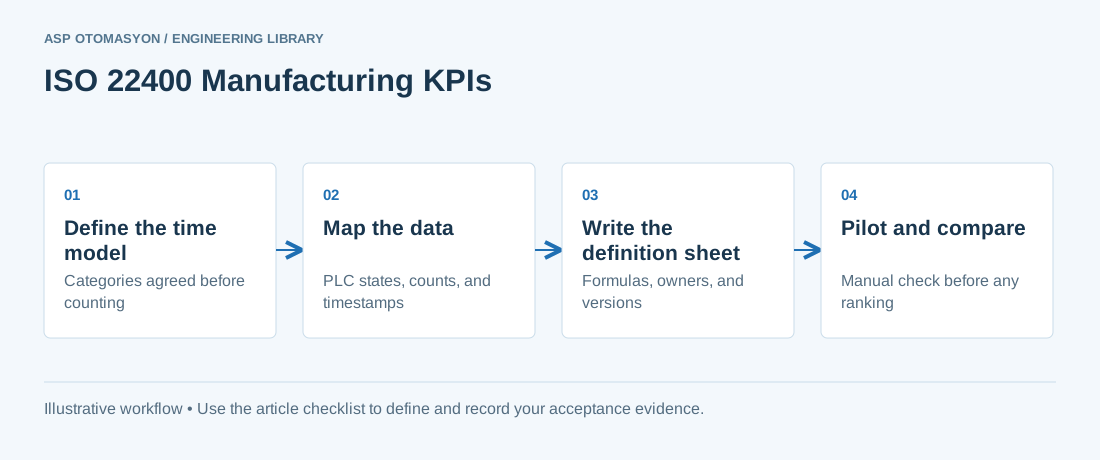
A site comparison is valid only when both sites use the same definition sheet. Before ranking sites, check whether each follows the same formulas and time categories. A difference in reported OEE is not evidence of a performance difference until the definitions match. Start with one line, then extend the rules once the pilot data has been checked by hand.
- Write the definition sheet. For each KPI, record the name, formula, time categories, data source, owner, and version.
- Recalculate one shift by hand. Compare the automated calculation with a manual count for a sample shift on the pilot line.
- Pilot on two lines. Include one line with frequent stops and one with frequent changeovers, so the rules are tested on different losses.
- Publish with change control. Treat any change to a formula or time category as a versioned change, and state its effective date in every report.
Limits and common misreadings
- A high OEE does not prove efficiency. It shows how much planned time produced good output at the ideal speed. Planning choices, product mix, and the ideal cycle time all influence it.
- OEE is not a root cause tool. Use loss data from OEE methodology implementation and the reason codes to find causes.
- Ideal cycle times drift. Revisit them after equipment or tooling changes, and keep the earlier values in the history.
- Energy measures need their own basis. Amendment 1 to ISO 22400-2 (2017) adds KPIs for energy management, defined on the same footing as the production KPIs. Resource measures such as specific energy consumption use a different denominator and must not be mixed into the OEE definition.
Apply this to your project
- The definition sheet names each KPI, its formula, its time categories, its data source, and its owner.
- Every calculated KPI can be traced back to the raw states, counts, and timestamps it used.
- Reports show availability, performance, and quality beside any OEE figure.
- A manual recount of one sample shift on each pilot line agrees with the automated calculation within an agreed tolerance.
- Ideal cycle times carry a stated source and a revision date.
- Any change to a formula or time category is versioned, approved, and dated in the reports that use it.
Follow an ASP project guide to connect the fundamentals with implementation and acceptance.
Frequently asked questions
Is ISO 22400 the same thing as OEE?
No. OEE is a composite measure that many plants use. ISO 22400 is a standard series that defines KPIs for manufacturing operations management, so that terms, formulas, and time categories are shared. A definition sheet based on the standard lets a site state its OEE precisely and compare it fairly with other sites that use the same rules.
Why do two plants report different OEE for the same line?
The usual causes are different planned production time, different treatment of minor stops and changeovers, different ideal cycle times, and different points for counting good output. The arithmetic can be identical while the inputs differ. Compare the definition sheets before comparing numbers, and report availability, performance, and quality beside the composite.
What data must a PLC provide for KPI calculation?
The PLC normally provides machine states with clear rules, count signals at a defined point, run or cycle information, and timestamps on a shared time base. The MES adds order context and the reason and quality classifications. Agree the state definitions and the counting point with operations before programming, so the signals mean what the KPI needs.
How many KPIs should a pilot start with?
Start with a few: availability, performance, quality rate, and the composite OEE on one or two lines. Add throughput or utilization only after the definitions are agreed and the data is trusted. A large set of KPIs built on unagreed definitions creates more disputes than insight.
Should the definition sheet cite the standard itself?
Yes, once the standard has been read. Cite the edition, part, and clause that each definition follows. This article does not give clause numbers. Until the applicable edition is in hand, label each formula as a site definition rather than a standard definition.
Continue the engineering work
- OEE: Methodology, Calculation and Implementation Pitfalls
- MES Downtime Reason Codes: Making Loss Data Useful to Operations
- MES Integration with Automation Systems — A Practical Approach
- ISA-95: Enterprise-Control System Integration
- Energy Benchmarking with Specific Energy Consumption (SEC)
Browse the related technical library or follow an ASP project guide to plan the implementation sequence.
Primary references and further reading
Use the original specifications and product documentation for implementation details. Examples in this guide are illustrative engineering scenarios, not published project results.
- ISO — ISO 22400-2:2014 Key performance indicators for manufacturing operations management, Part 2: Definitions and descriptions
- ISO — ISO 22400-2:2014/Amd 1:2017 Key performance indicators for energy management
- Swedish Institute for Standards (SIS) — ISO 22400-2:2014 catalogue entry
- ISA — ISA-95/IEC 62264 Enterprise-Control System Integration
- OPC Foundation — OPC Unified Architecture online reference