
Overall Equipment Effectiveness (OEE) is the standard metric of manufacturing productivity: it combines availability, performance, and quality into one number that says how well an asset converts its scheduled time into good product. OEE's power is not the single number — it is the decomposition. The three factors point directly at the loss categories (downtime, speed, and quality losses) that improvement projects must attack. But OEE is also one of the most mis-measured KPIs in industry, because small definition differences produce numbers that cannot be compared.
The Formula
OEE = Availability × Performance × Quality
- Availability = Operating Time / Planned Production Time. Planned production time excludes scheduled breaks, maintenance windows, and changeovers planned — but includes everything else that stops the line.
- Performance = Ideal Cycle Time × Total Parts / Operating Time — how fast the equipment ran while it ran. It captures speed losses: small stops, slow running, machine warm-up, and also running below the nameplate rate.
- Quality = Good Parts / Total Parts Produced — first-pass yield of the asset, counting rework and scrap at this asset (not later in the line).
World-class OEE is often cited around 85% (Availability 90% × Performance 95% × Quality 99.9%). Typical "effective" plants run 60–75%; the gap is the improvement backlog.
The Six Big Losses
| Loss | OEE factor | Examples |
|---|---|---|
| Equipment failure | Availability | Breakdowns, unplanned repairs |
| Setup and adjustment | Availability | Changeovers, settings, warm-up |
| Idling and minor stops | Performance | Sensor jams, product flow interruptions, brief trips |
| Reduced speed | Performance | Running below nameplate, wear, suboptimal settings |
| Process defects | Quality | Scrap, rework at the asset |
| Reduced yield (startup) | Quality | Ramp-up losses after start or changeover |
The loss classification drives the Pareto: most plants find that 20% of loss codes cause 80% of OEE loss, which is exactly what the improvement program should attack first.
Measuring OEE Correctly
Automated OEE needs three data streams per asset: state (running, stopped, and the stop reason — from PLC logic or a manual entry terminal), count (parts produced — from sensors, PLC counters, or the machine's own reporting), and quality (good vs bad — from inspection stations or the MES). Design rules:
- Define the states and reasons once — a stop reason taxonomy (breakdown, changeover, material shortage, cleaning, no operator, quality hold) agreed plant-wide and encoded in the machine HMI.
- Automate state detection where possible — PLC-based state machines are more honest than operator-entered reasons; combine them (PLC state + operator reason for unexplained stops).
- Validate counts — reconcile PLC counts with the MES/shop floor counts daily; count drift is the most common OEE data corruption.
- Compute at the asset, roll up at the plant — OEE per line, per cell, per plant must be aggregatable; line-level losses roll up to plant-level availability correctly only if the definitions are identical.
- Timestamp everything UTC — shift boundaries and time zones otherwise corrupt the daily numbers.
Implementation Pitfalls
- Moving targets — changing the ideal cycle time to make OEE look better. The ideal cycle time is a technical parameter (best demonstrated performance), not a management dial.
- Unplanned time in the denominator — adding overtime or extra shifts into planned production time inflates availability. Planned time must be the published schedule.
- Quality double-counting — counting rework as good at the asset and again at the inspection station; quality is measured at the asset that created the defect.
- Comparing across plants — OEE is comparable only with identical definitions; benchmark within one standard first.
- Dashboards without action — an OEE display that nobody reviews in the shift meeting is decoration. Tie the number to a structured loss review (why was OEE 72% yesterday? which losses?).
- Over-automation of reasons — a stop reason entry system so slow that operators stop using it; design for one tap, or fall back to PLC detection.
From Measurement to Improvement
OEE programs succeed when the metric feeds a closed loop: daily review of the loss Pareto, weekly structured problem solving on the top losses, monthly validation of the measurement (is the number still honest?), and quarterly target setting per asset. The metric's job is to direct attention; the improvement work is where value is created. Many plants get the measurement right and still fail because nobody owns the loop.
Summary
OEE decomposes productivity into availability, performance, and quality losses. Define the states, reasons, and ideal cycle times once; automate and validate the data streams; compute consistently and roll up honestly; and attach the number to a loss-review loop. The formula is simple; the discipline is not — and the discipline is the point.
Keep loss definitions stable across reports
Agree the production-time boundary, ideal-cycle basis, quality-count rules, and downtime classification with operations. Preserve the original machine timeline when reason codes are corrected. Compare lines only when the definitions and measurement quality support the comparison. A headline percentage is less useful than a traceable explanation of where time and output were lost.
Continue with the related practical guide.
Apply this to your project
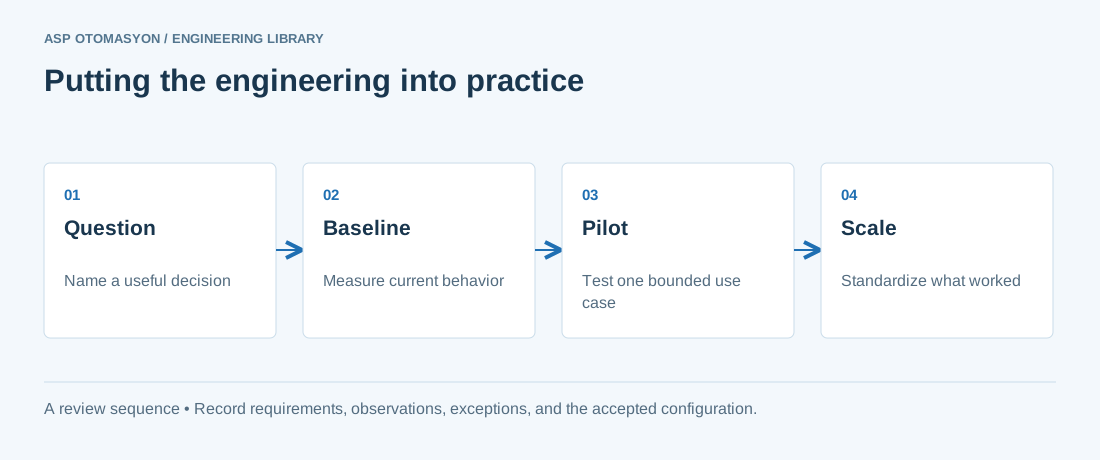
- Name the operational decision, its owner, and the evidence required to judge whether it improved.
- Document asset identifiers, units, timestamps, quality rules, and definitions shared between OT and business applications.
- Compare the pilot against a recorded baseline before extending it to other machines or sites.
Follow an ASP project guide to connect the fundamentals with implementation and acceptance.
Primary references and further reading
Use the original specifications and product documentation for implementation details. The examples in this guide are illustrative engineering scenarios, not published project results.