
Cloud SCADA and remote monitoring extend the plant control and visibility layer beyond the control room. Instead of (or alongside) an on-premises SCADA server, process data is streamed to a cloud platform where operators, engineers, and management can view live values, trends, and alarms from anywhere. Done well, this unlocks remote support, multi-site visibility, and advanced analytics; done carelessly, it can expose a plant to latency, security, and reliability problems. This article covers the architectures, the integration patterns, and the decisions that keep cloud monitoring safe and useful.
Architecture Options
1. Edge relay + cloud historian (most common)
An edge gateway at the plant collects data from PLCs/DCS via OPC UA or native protocols, buffers it locally, and publishes it to a cloud platform over MQTT, OPC UA, or REST. The cloud stores the data and serves dashboards. This is the pattern used by most industrial IoT platforms and fits existing plants without touching the control network.
2. Cloud-hosted SCADA (full)
The entire SCADA application — screens, alarms, historian, and even control logic execution — runs in the cloud, with the plant connected through secure gateways. This suits small sites or multi-site fleets where on-premises servers are undesirable, but it introduces network dependency for every operator action.
3. Hybrid
On-premises SCADA remains the primary operator interface (for reliability and low latency), while a cloud platform adds remote visibility, analytics, and reporting. This is the recommended approach for critical processes: operations never depend on the WAN, but the cloud enriches the data.
Integration Patterns from the Plant
Whatever the platform, data must leave the plant safely:
- OPC UA to MQTT bridging — see the OPC UA to MQTT Bridge Patterns article; the edge gateway maps UA nodes to MQTT topics.
- Sparkplug B — an MQTT payload standard designed for industrial telemetry with a defined topic hierarchy and state management (see MQTT and Sparkplug).
- Direct OPC UA client in the cloud — suitable only with a secure, low-latency tunnel (VPN) and strong certificate management; not recommended across the public internet.
- File/edge export — batch export (CSV, Parquet) for analysis pipelines where real-time is not required.
Security: The Non-Negotiable Layer
Remote monitoring connects the OT network to the internet; security is the primary design constraint:
- Outbound-only connections. The edge gateway initiates connections to the cloud; the plant never accepts inbound connections. This removes the need to open firewall ports at the plant.
- Encryption and authentication. TLS for all transport; device certificates or API keys for the gateway; MQTT over TLS with client certificates where supported.
- Segmentation. Place gateways in a DMZ or on a dedicated network segment, with firewall rules limiting what they can reach in the OT network (see the Purdue Model article).
- Least privilege. Cloud users get role-based access; operators see their plant, engineers see configuration, and nothing is world-readable.
- Audit and monitoring. Log gateway connections, user logins, and configuration changes; alert on anomalies.
- Asset protection. Keep firmware and certificates updated; a compromised gateway is a foothold into the plant.
Latency, Reliability, and Control Boundaries
- Understand the latency budget. Cloud round-trips are measured in hundreds of milliseconds to seconds. Monitoring tolerates this; closed-loop control does not. Never put fast or safety-relevant control logic on a cloud round-trip.
- Buffer at the edge. The gateway must buffer data during WAN outages and replay on reconnect; otherwise the cloud history has gaps exactly when it matters most.
- Define read-only vs. write access. For critical plants, cloud users are view-only. If remote commands are genuinely required, route them through the edge gateway with confirmation, logging, and interlocks, and keep a hard-wired local override.
- Test the failure path. What happens to the cloud dashboard when the link drops? Operators must know the difference between "plant is fine but link is down" and "plant is down". Include connection status in the UI.
Choosing the Platform
Platform selection depends on the use case:
- Multi-site KPI and alarm visibility: cloud SCADA/IIoT platforms with dashboards and notification engines (e.g., via email/SMS/push).
- Deep analytics and AI: cloud data platforms with time-series databases and ML tooling; the historian data is streamed or batch-loaded.
- Compliance and reporting: platforms with audit trails and report generation for regulated industries.
Check the platform's data ownership, exportability, and lock-in: the data belongs to the plant, and the platform should make it easy to get it back out (open APIs, standard formats).
Rollout Approach
- Start with one site or one line; collect a defined tag set (see the historian tag strategy).
- Deploy the edge gateway with buffering and outbound-only security; validate data quality and continuity through a link-outage test.
- Build a small dashboard for a real audience (maintenance or management) and iterate on what they actually use.
- Only then expand to more sites and add write/command features if genuinely justified.
Summary
Cloud SCADA and remote monitoring deliver real value — remote support, multi-site visibility, and analytics — when architected with respect for the OT environment. Use edge relays with outbound-only, encrypted connections; keep control local; buffer through outages; and expand from a validated pilot. The cloud should enrich the plant's data, never become a dependency of its operation.
Apply this to your project
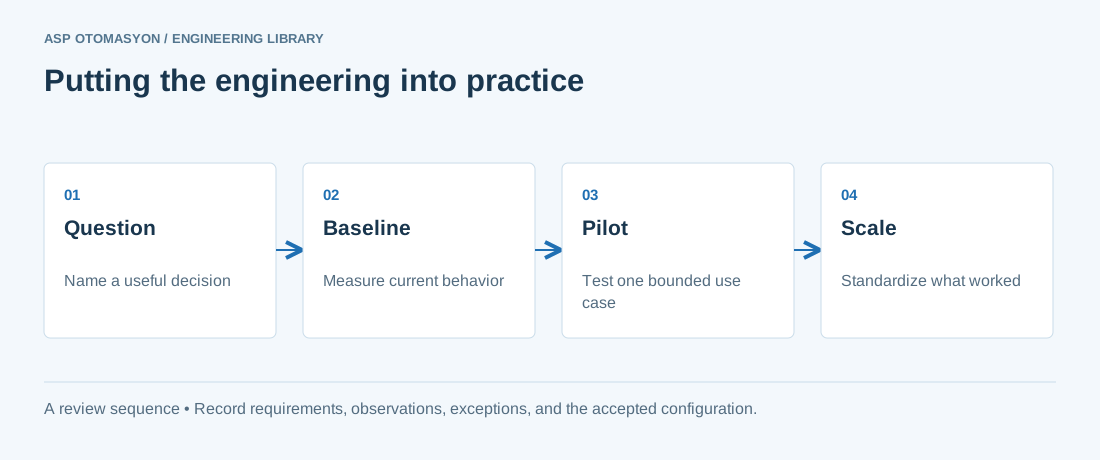
- Name the operational decision, its owner, and the evidence required to judge whether it improved.
- Document asset identifiers, units, timestamps, quality rules, and definitions shared between OT and business applications.
- Compare the pilot against a recorded baseline before extending it to other machines or sites.
Follow an ASP project guide to connect the fundamentals with implementation and acceptance.
Primary references and further reading
Use the original specifications and product documentation for implementation details. The examples in this guide are illustrative engineering scenarios, not published project results.