
OPC UA is the most common integration fabric in modern industrial systems, and most integration projects eventually hit the same wall: a client that cannot connect, a connection that drops under load, or data that arrives slower than the application needs. Because OPC UA hides so much complexity behind a simple connect call, the failure surface is wide — security, networking, configuration, and capacity all look identical from the client's perspective. A systematic troubleshooting method resolves these issues in minutes instead of days.
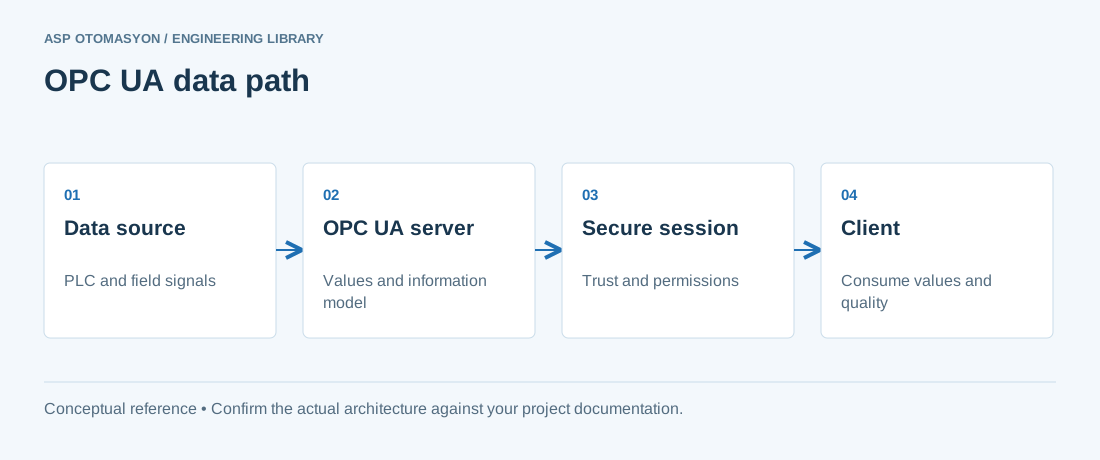
The Connection Stack
Every OPC UA connection involves four layers that must all work:
- Transport — TCP reachability and port 4840 (default) reachable from the client to the server, with no firewall or NAT blocking.
- Security handshake — the client must have a trusted certificate for the server (or a security policy that allows anonymous), and vice versa; both endpoints must support a common security policy (None, Basic256Sha256, Aes128Sha256RsaOaep).
- Application layer — the endpoint URL must match what the server publishes, including the path and the hostname that the server's certificate was issued for.
- Session and subscription — the session must be created with acceptable parameters, and subscriptions must publish within the configured interval.
Diagnose in this order; each layer produces a distinct error signature.
Classic Failure Signatures
| Symptom | Most likely cause | Fast check |
|---|---|---|
| Connection refused / timeout | Firewall, wrong port, server not running | telnet server 4840 or nc -vz; check listener on the server. |
| BadCertificate / certificate rejected | Untrusted certificate chain, expired cert, wrong hostname in cert | Compare the server's certificate details with its URI/hostname; import the CA into the client's trust store. |
| Security policy mismatch | Client and server configured with no common policy | List the server's endpoints with a discovery tool (e.g., UaExpert) and match exactly. |
| BadSessionId / session closed after connect | Server session limit reached; client reconnects too aggressively | Check server session diagnostics; reduce the number of clients or increase the limit. |
| Connection drops periodically | Keep-alive timeout, NAT timeout, firewall idle timeout | Reduce the session timeout / keep-alive interval on the client; check for idle timeouts. |
| Slow updates on a fast-changing tag | Publishing interval, sampling interval, or queue size misconfigured | Verify the subscription publishing interval and the monitored item sampling interval; both must match the required rate. |
Certificate Troubleshooting Steps
- Export the server certificate (or use a discovery client) and inspect its validity period, subject, and SubjectAltName URI.
- Install the server's CA certificate into the client's trusted issuer store and the server certificate into the trusted peer store (or use the application's automatic trust-on-first-use feature deliberately — and document it).
- Repeat in reverse: the server must trust the client's certificate for mutual authentication.
- Restart both applications and re-test; certificate stores are usually read at startup.
- If using a Global Discovery Server (GDS), verify the GDS's certificate and the push-management enrollment state.
Note the asymmetry trap: many products accept any client certificate but reject unknown server certificates. Always test in both directions.
Performance Tuning
When connections work but throughput disappoints, tune in this order:
- Sampling vs publishing — the server samples the source at the sampling interval, then publishes at the publishing interval. For fast data, set both low (e.g., 100 ms); for slow data, raise them and save bandwidth.
- Queue size and discard policy — if the client cannot keep up, the server's monitored-item queue overflows. Use the "discard oldest" policy for fast-changing values or "discard newest" where the latest value matters more.
- Value aggregation — request only the attributes you need (value, not all timestamps) and subscribe to values instead of polling read calls.
- Batch reads — for periodic scans, use one multi-node Read instead of hundreds of single reads.
- Node structure — a flat address space with thousands of tags under one folder is legal but slower to browse; hierarchical organization and the server's fast-path optimization help.
- Network path — verify round-trip latency (ping) and packet loss between client and server; OPC UA is TCP-based and suffers from lossy links.
Diagnostics Tooling
Build a small diagnostic kit and use it consistently: UaExpert (or UA Reference Client) for endpoint discovery and certificate inspection; Wireshark with the OPC UA dissector for handshake-level analysis; the server's own diagnostics view (session list, subscription counters, error counters) which most servers expose in their address space; and the client's log files. One rule saves most projects: reproduce the failure with a generic client first — if UaExpert connects, the issue is in the application's configuration, not the infrastructure.
Summary
OPC UA troubleshooting is layered: transport, security, session, subscription. Check reachability, then certificates and policies, then session parameters, then publish/sample configuration. Keep the server's diagnostics visible, use a generic client to isolate the fault side, and tune performance by matching sampling, publishing, and queue behavior to the data's actual rate. Most "OPC UA is slow" complaints are configuration mismatches, not protocol limits.
Apply this to your project
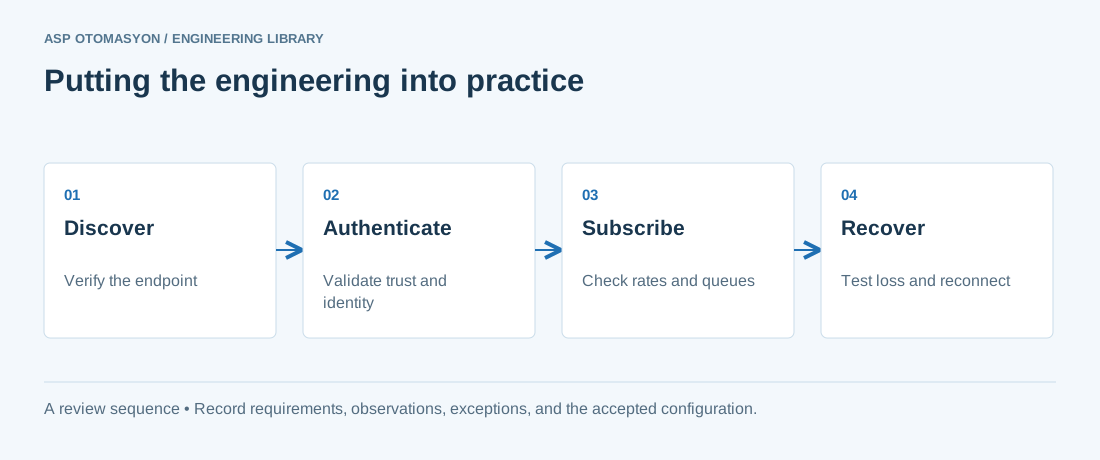
- Record the endpoint, supported security policies, application identity, certificate expiry, and user permissions.
- Verify the value, engineering unit, StatusCode, and source timestamp together at the receiving application.
- Test disconnection and recovery with representative subscriptions; preserve evidence of any data gaps or repeated values.
Follow an ASP project guide to connect the fundamentals with implementation and acceptance.
Primary references and further reading
Use the original specifications and product documentation for implementation details. The examples in this guide are illustrative engineering scenarios, not published project results.