
Energy is one of the largest controllable costs in industrial manufacturing, typically representing 15–40% of total operational expenditure depending on the sector. Industrial Energy Monitoring Systems (EMS) provide real-time visibility into energy consumption patterns, enabling facility managers and engineers to identify waste, optimize usage, and reduce costs. When properly implemented, an EMS can deliver energy savings of 15–30% with payback periods of 12–24 months, making it one of the highest-ROI investments available to industrial facilities.
What Is an Industrial Energy Monitoring System?
An Industrial EMS is an integrated hardware and software platform that continuously measures, records, and analyzes energy consumption across a facility. Unlike utility billing meters that provide monthly aggregate data, an EMS delivers granular, real-time information at the machine, production line, zone, or process level. This level of visibility is essential for identifying energy waste, verifying savings from efficiency projects, and maintaining ISO 50001 compliance.
Modern EMS platforms incorporate four key components:
- Smart meters and submeters — Revenue-grade and non-revenue meters for electrical energy (kWh, kVARh), gas, water, steam, and compressed air. These meters form the measurement backbone of the system.
- Data acquisition gateways — Industrial protocol converters supporting Modbus RTU/TCP, M-bus, BACnet, MQTT, and IEC 61850. These gateways aggregate data from hundreds of meters and translate it into a unified data stream.
- Software analytics engine — Dashboards, reports, alerts, and automated control strategies that transform raw data into actionable insights for operators and management.
- Control integration — Direct connection to PLCs, DCS, and BMS systems for automated demand response and load shedding, closing the loop from monitoring to action.
Key Metrics Monitored
A comprehensive EMS tracks a defined set of electrical and thermal parameters at every measurement point. Understanding these metrics is essential for interpreting energy data correctly:
| Metric | Symbol | Unit | Description | Business Impact |
|---|---|---|---|---|
| Active Power | P/kW | kW | Real power consumed by equipment at an instant | Direct billing, demand charges |
| Reactive Power | Q/kVAR | kVAR | Non-working power from inductive loads | Power factor penalties |
| Apparent Power | S/kVA | kVA | Vector sum of real and reactive power | Transformer and cable sizing |
| Energy Consumption | E | kWh | Integral of active power over time | Utility billing, carbon accounting |
| Reactive Energy | ER | kVARh | Integral of reactive power over time | Power factor correction ROI |
| Power Factor | PF | — | Ratio of active to apparent power (cos φ) | Utility penalties below 0.90–0.95 |
| Maximum Demand | MD | kW/kVA | Highest average over demand interval | Capacity charges, peak shaving |
| Current | I | A | RMS current per phase | Load balancing, thermal limits |
| Voltage | V | V | Phase-to-phase and neutral RMS | Power quality, equipment protection |
| THD | THD | % | Harmonic content vs. fundamental | Transformer heating, nuisance trips |
| CO₂ Emissions | CO₂e | kg/h / t | Energy × emission factor | Sustainability, carbon tax |
| SEC | SEC | kWh/unit | Energy per unit of production | Benchmarking, improvement |
System Architecture
A well-designed EMS follows a layered architecture that separates concerns and enables scalability:
  +------------------------------------------------------------------+
  |                    PRESENTATION LAYER                              |
  |  Dashboards  |  Reports  |  Alerts  |  Energy Portal  |  API      |
  +------------------------------------------------------------------+
  |                     ANALYTICS & HISTORIAN                          |
  |  Data Aggregation  |  Normalization  |  Forecasting  |  ML Engine |
  +------------------------------------------------------------------+
  |                     DATA ACQUISITION LAYER                          |
  |  Gateway 1 (Modbus)  |  Gateway 2 (BACnet)  |  Gateway 3 (M-bus)  |
  +------------------------------------------------------------------+
  |                     FIELD INSTRUMENTATION LAYER                     |
  |  Power Meters  |  Submeters  |  Gas Meters  |  Flow Meters  |  CTs |
  +------------------------------------------------------------------+
  |                     ELECTRICAL DISTRIBUTION LAYER                   |
  |  MV Switchgear  |  LV Switchboards  |  MCCs  |  Distribution Panels|
  +------------------------------------------------------------------+
Field Instrumentation Layer
Revenue-grade power quality meters (IEC 61557-12, IEC 62053-22 class 0.2S or 0.5S) are installed at the utility incoming supply, main switchboards, and key distribution points. Submeters are deployed at production lines, large motors (above 37 kW), HVAC systems, compressors, and lighting panels. Current transformers (CTs) with 1A or 5A secondary outputs interface with the meters. The selection of appropriate CT ratios is critical — typically the primary rating should be 130–150% of the expected maximum load current to ensure accuracy at normal operating levels while avoiding saturation during peak conditions.
Communication Protocols
| Protocol | Physical Layer | Typical Use | Max Distance | Max Devices |
|---|---|---|---|---|
| Modbus RTU | RS-485 | Legacy meters, indoor short-distance | 1200 m | 32 per segment |
| Modbus TCP | Ethernet | Modern meters, plant network | 100 m per segment | 247 per server (IP scalable) |
| M-bus | 2-wire | Utility submeters (water, gas, heat) | 1000 m | 250 per segment |
| BACnet MS/TP | RS-485 | Building management integration | 1200 m | 128 per segment |
| BACnet/IP | Ethernet | BMS over IP networks | Unlimited (routed) | Unlimited |
| IEC 61850 | Ethernet | Substation and MV monitoring | 100 m per segment | Unlimited |
| MQTT / Sparkplug | TCP/IP | Cloud and IIoT connectivity | Unlimited | Unlimited |
Submetering Strategy
Effective submetering follows the principle of measure what matters. The Pareto principle (80/20 rule) applies: 80% of energy is typically consumed by 20% of the loads. Prioritize submetering for:
- High-consumption processes — Kilns, furnaces, compressors, chillers, pumps over 75 kW. These are the largest individual consumers and should always be individually metered.
- Variable-load systems — HVAC, lighting circuits, and compressed air networks. These systems have significant savings potential through operational optimization.
- Cost allocation points — Tenant spaces, cost center boundaries, and product lines. Accurate cost allocation drives accountability and behavior change.
- Regulatory monitoring — Emission stacks and environmental compliance points required by regulation.
A hierarchical submetering architecture organizes meters in a tree structure: Utility Incoming → Main Switchboard → Distribution Boards → Individual Loads. This enables bottom-up summation and loss analysis between levels — if the sum of submeters is consistently less than the main meter by more than 2–3%, it indicates unmeasured loads or meter calibration issues.
Load Management and Peak Shaving
Peak demand charges frequently account for 30–50% of an industrial electricity bill. In many countries, including Turkey, the demand charge is calculated based on the highest 15-minute or 30-minute average power draw during the billing period. An EMS enables active peak shaving through several complementary strategies:
- Load shedding — Automatically shedding non-critical loads when demand approaches a preset threshold. Priority-based shedding ensures that essential processes continue uninterrupted. Shedding is typically implemented through the PLC or DCS system, with the EMS providing the demand forecast signal.
- Load shifting — Moving energy-intensive operations (grinding, crushing, electric furnaces) to off-peak periods when time-of-use rates are lower. This requires coordination with production scheduling systems.
- Process optimization — Staggering the startup of large motors to prevent simultaneous inrush current spikes. A simple but effective strategy that requires no additional hardware.
- On-site generation — Deploying battery energy storage systems (BESS) or backup generators during peak demand intervals to reduce grid draw. With declining battery costs, BESS for peak shaving is becoming economically viable for many facilities.
- Demand response — Participating in utility demand response programs where the facility voluntarily reduces consumption in exchange for financial incentives. Turkey has active demand response programs managed by TEİAŞ and EPİAŞ.
Cost Allocation and Energy Billing
Beyond monitoring, an EMS enables sophisticated cost allocation models that drive accountability. Common allocation methods include:
- Direct metering — Each cost center has a dedicated meter. Most accurate but highest hardware cost.
- Proportional allocation — Energy is allocated based on production volume, operating hours, or floor area.
- Activity-based allocation — Energy assigned to specific production runs or batches based on measured consumption during the run.
- Load factor-based demand allocation — Demand charges allocated proportionally to each cost center contribution to peak demand.
ISO 50001 Alignment
ISO 50001:2018 provides a systematic framework for energy management following the Plan-Do-Check-Act (PDCA) cycle. An EMS directly supports every phase of the standard:
- Energy baseline (EnB) — Historical consumption data normalized for production volume, weather, and other relevant variables. The EnB is the reference point against which all improvements are measured.
- Energy performance indicators (EnPIs) — SEC, energy cost per unit produced, peak demand normalized to production rate, and carbon intensity. EnPIs must be defined for each significant energy use (SEU).
- Significant energy uses (SEUs) — Identification and continuous monitoring of the 10–15 largest energy-consuming processes. An EMS automatically identifies SEUs by analyzing consumption data across all metering points.
- Action plans and verification — Tracking of energy reduction projects with measured and verified savings using the IPMVP (International Performance Measurement and Verification Protocol) framework.
- Management review data — Automated generation of monthly energy performance reports for ISO 50001 management review meetings, including trend charts, SEU status, and project tracking.
Carbon Tracking and Sustainability
With increasing regulatory pressure (EU Emissions Trading System, Turkish carbon pricing mechanisms), industrial facilities must accurately track and report CO₂ emissions. An EMS supports carbon tracking by:
- Converting energy consumption (kWh, m³ of natural gas, tons of steam) to CO₂e using applicable emission factors.
- Tracking Scope 1 (direct: natural gas, fuel oil), Scope 2 (purchased electricity), and Scope 3 (supply chain) emissions.
- Generating sustainability reports aligned with GRI (Global Reporting Initiative) and CDP (Carbon Disclosure Project) requirements.
- Verifying carbon reduction from energy efficiency projects with measured, not estimated, data.
ABB Energy Management Solutions
ABB provides a comprehensive EMS portfolio under the ABB Ability™ Energy Management System umbrella. Key offerings include:
- ABB Ability™ Energy Manager — A cloud-based subscription platform for multi-site energy monitoring with automated ISO 50001 reporting, CO₂ tracking, configurable KPI dashboards, and role-based access. Ideal for enterprises managing multiple facilities.
- ABB Ability™ OPTIMAX® Energy Monitoring and Reporting — An on-premises solution for real-time energy monitoring with advanced analytics, load forecasting, alarm management, and integration with existing automation systems.
- ABB EMpro and M4M power meters — High-accuracy panel-mounted power quality meters with Modbus and Ethernet connectivity, supporting Class 0.2S accuracy and harmonic analysis to the 63rd order. These meters provide the measurement foundation for any EMS deployment.
- ABB Ability™ Energy and Asset Manager — MV/LV switchgear-integrated monitoring for electrical distribution systems within ABB switchgear platforms.
ASP OTOMASYON A.Ş. and its subsidiaries OPCTurkey and ASP Dijital provide end-to-end industrial engineering solutions for process automation, data operations and AI.
References & Further Reading
- ISO 50001:2018 — Energy Management Systems — International standard for establishing, implementing, and improving energy management systems using the Plan-Do-Check-Act framework.
- ISO 50006:2014 — Energy Baselines and Energy Performance Indicators — International standard providing guidance on establishing energy baselines (EnB) and energy performance indicators (EnPI) for measurement and verification.
- IEC 62053 Series — Electricity Metering Equipment Standards — International standards for AC static electricity meters, including accuracy classes 0.2S, 0.5S, and 1.0 for revenue-grade metering applications.
- IEC 61850 — Communication Networks and Systems for Power Utility Automation — International standard for substation automation, communications, and energy monitoring in electrical distribution systems.
- DLMS/COSEM — Device Language Message Specification — Official standard for data exchange with energy meters, supporting multi-vendor interoperability in advanced metering infrastructure (AMI) deployments.
- ASHRAE BACnet — Building Automation and Control Networks — Official BACnet protocol standard (ISO 16484-5) for integrating building management systems with industrial energy monitoring platforms.
Verify ratios and production context first
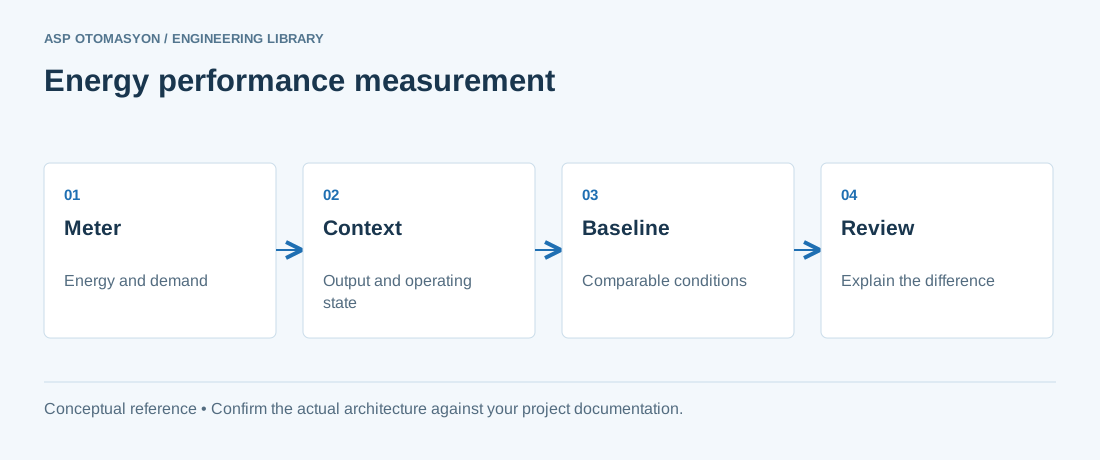
Check meter identity, CT/PT ratios where applicable, unit scaling, accumulated-counter behavior, and interval alignment before presenting an energy dashboard. Record production quantity and operating state alongside consumption. Compare equivalent boundaries and explain normalization assumptions. A lower monthly total may reflect lower production rather than better energy performance.
Continue with the related practical guide.
Apply this to your project
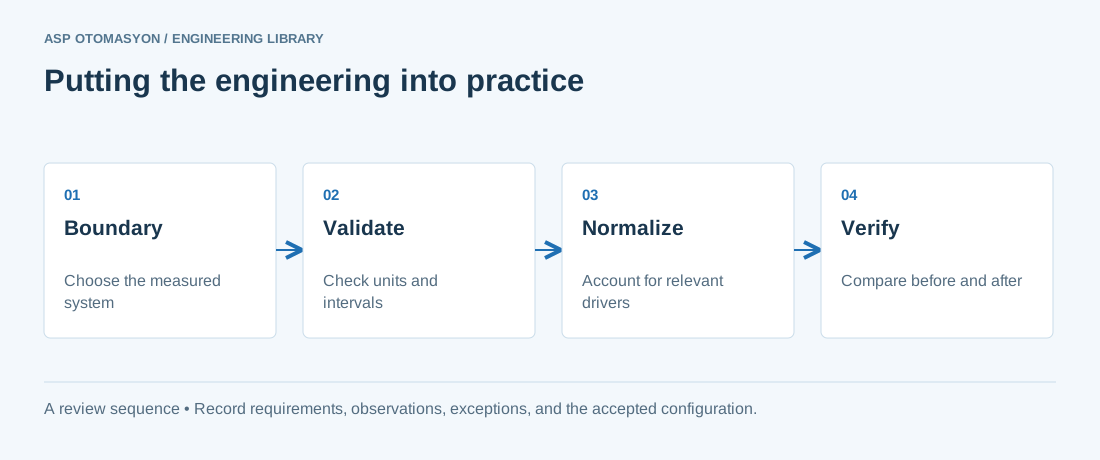
- Define the measurement boundary, meter ratios, units, time interval, and treatment of missing or reset readings.
- Capture production quantity, operating hours, and other relevant drivers alongside energy use.
- State the baseline and normalization assumptions when reporting a change; separate measured results from estimates.
Follow an ASP project guide to connect the fundamentals with implementation and acceptance.
Primary references and further reading
Use the original specifications and product documentation for implementation details. The examples in this guide are illustrative engineering scenarios, not published project results.