
An ISO 50001 energy management system is built on measurement: without a way to quantify energy performance, improvement is an opinion. ISO 50006 ("Energy management systems — Measuring energy performance using energy baselines (EnB) and energy performance indicators (EnPI)") is the standard that makes this quantification rigorous: it defines how to choose the right indicators, how to establish the baseline, and how to normalize for the variables that drive energy use. It is the difference between "we reduced our energy" and "we know our energy performance, and here is the evidence."
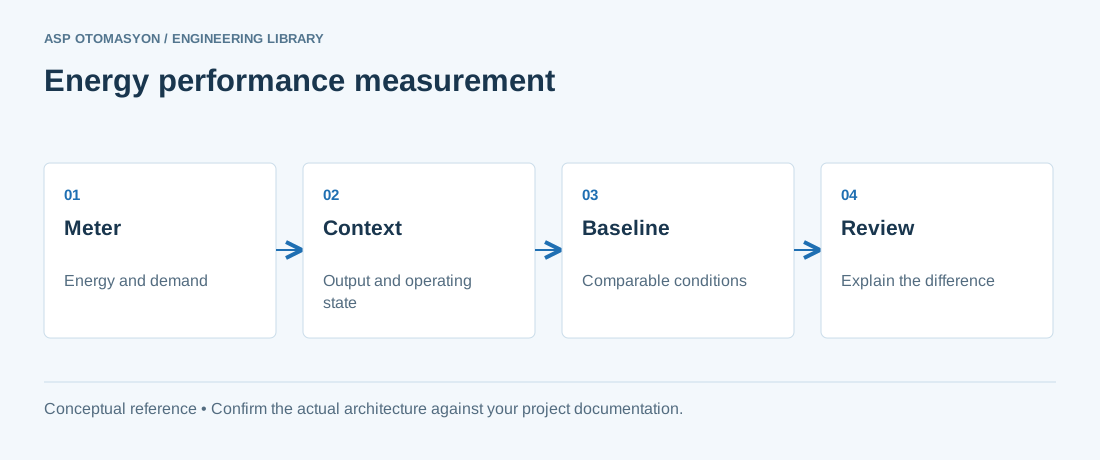
EnPI vs EnB: The Core Pair
- Energy Performance Indicator (EnPI) — the metric that expresses energy performance: SEC (energy per unit of output), energy per square meter, energy per hour of operation, or a modeled value. The EnPI is the number being managed.
- Energy Baseline (EnB) — the quantified reference for the EnPI: the "before" state against which changes are measured. The EnB is established from a defined baseline period and remains the comparison point (until it is legitimately reset).
The relationship is simple: performance improvement = EnPI today vs the EnB, with the comparison made meaningful by normalization. Without a baseline, every energy claim is anecdote; without a valid EnPI, the baseline cannot be compared.
Choosing the Right EnPI
ISO 50006 guides the choice by the relevant variables — the factors that significantly drive energy use at the site:
| Relevant variable | Appropriate EnPI form |
|---|---|
| Production output dominates (most manufacturing) | SEC: kWh per ton/piece/liter — a static simple ratio. |
| Weather drives the load (buildings, HVAC-heavy sites) | Weather-normalized EnPI: energy vs degree-days, or a regression model including weather. |
| Multiple drivers (output + weather + mix) | Regression/model-based EnPI: predicted energy = f(variables), actual vs predicted as the indicator. |
| Fixed schedules, low production dependence (data centers, some utilities) | Energy per time unit (kWh/day) with utilization corrections; or PUE-style ratios. |
The selection evidence is data: a regression of historical energy vs candidate variables shows which variables matter (R², significance). Choosing an EnPI without the data analysis is the most common ISO 50006 failure — the indicator then fluctuates with an unmanaged variable and nobody trusts it.
Establishing the Baseline
Baseline rules that make the system honest:
- Representative period — typically 12 months (or at least a full season cycle), covering the operating range; the baseline period is documented with its production and weather profile.
- Defined boundary — which systems, which meters, which energy carriers; the boundary matches the EnPI's scope and does not drift silently.
- Normalization model — for model-based EnPIs, the baseline is the model itself: predicted energy for given variable values. Deviations from predicted are the performance signal.
- Stability review — the baseline is re-baselined when the site changes materially (new plant, major equipment change, boundary change) — ISO 50001 requires the review; keeping a dead baseline makes the system fiction.
Using EnPI/EnB in the EMS
The EnPI is only useful when it is operated:
- Automated computation — the EnPI is calculated from the metered energy and the production data automatically, monthly (or weekly for active management) — see the EMS and SEC articles.
- Performance review — actual EnPI vs EnB in the management review, with the variance explained (production mix, weather, known events, or true performance change).
- Targets — improvement targets are set on the EnPI ("SEC −8% by 2027 vs the 2024 baseline") and tracked quarterly.
- Verification of measures — efficiency projects are verified by comparing post-project EnPI to the baseline (with normalization) — the evidence that the investment worked.
- Anomaly detection — an EnPI deviating from the model when nothing changed is the early-warning signal for waste (leaks, failures, schedule drift) — the same pattern as the SEC trend.
Summary
ISO 50006 makes energy performance measurable: choose the EnPI from the data (the relevant variables), establish a representative, documented baseline, and operate the pair — automated computation, variance explanation, targets, verification, and anomaly detection. The EnPI is the instrument; the baseline is its calibration. A plant with a well-run EnPI/EnB pair knows its energy performance the way it knows its production — and can prove it.
Apply this to your project
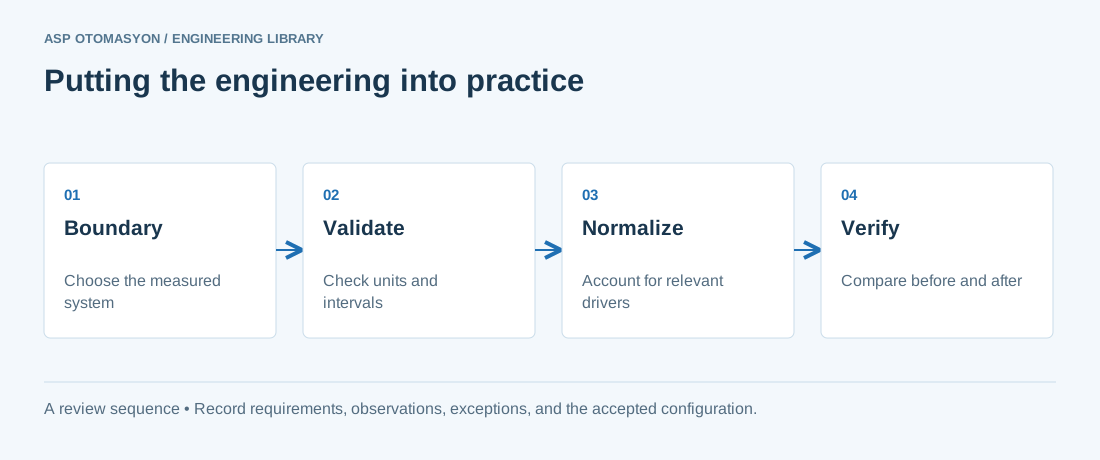
- Define the measurement boundary, meter ratios, units, time interval, and treatment of missing or reset readings.
- Capture production quantity, operating hours, and other relevant drivers alongside energy use.
- State the baseline and normalization assumptions when reporting a change; separate measured results from estimates.
Follow an ASP project guide to connect the fundamentals with implementation and acceptance.
Primary references and further reading
Use the original specifications and product documentation for implementation details. The examples in this guide are illustrative engineering scenarios, not published project results.