
Savings cannot be metered directly, so IPMVP-based measurement and verification compares adjusted before-and-after energy data inside a defined boundary.
Energy savings cannot be read off a meter. A meter records what a plant consumed, not what it avoided. Savings are therefore an estimate: post-project consumption is compared with the consumption expected without the project, after adjusting for changes in weather, production, and occupancy. Measurement and verification (M&V) is the discipline that makes that estimate credible enough for a performance contract, a utility incentive, a corporate target, or an investment review.
This article explains the framework in the International Performance Measurement and Verification Protocol (IPMVP), its four options and how to choose between them, the baseline and adjustment logic, the contents of an M&V plan, and what a credible report contains. A worked example uses assumed numbers to show why normalization matters. For the method behind such comparisons, see energy baseline normalization and the indicators in energy performance indicators.
M&V estimates the contribution of one project, with stated uncertainty, relative to a defined baseline. The EVO framework makes the core point: savings represent the absence of energy use, so they are determined by comparing measured use before and after a measure and adjusting for changes in conditions.
M&V does not prove that a plant is efficient overall. A plant that uses less energy because it produced less has not saved that energy through the project. Adjustments exist to separate those effects, and a credible report shows them separately.
The measurement boundary is the line around the equipment and energy flows that the project affects. Energy flows that cross the boundary should be evaluated, and any flow the measure affects must be measured. The boundary is the first design decision because it sets how much metering is needed.
The baseline period is the pre-project interval that defines the reference. The reporting period is the post-project interval. Independent variables, such as outdoor temperature, production volume, or operating hours, explain energy changes that the project did not cause. The DOE M&V guidelines express the logic as baseline energy minus post-installation energy, plus or minus adjustments.
Routine adjustments are planned and repeated, such as a monthly regression on production and weather. Non-routine adjustments respond to events the plan did not foresee, such as an added building wing, a new product mix, or a changed shift pattern. The M&V plan must say which adjustments are routine, how their variables are measured, and how non-routine events will be logged.
IPMVP defines four options. Options A and B are retrofit isolation methods that measure the affected equipment. Option C measures the whole facility. Option D uses a calibrated simulation model. The DOE guidelines note that Option D can be applied either way but is usually used as a whole-facility method.
| Option | What is measured | Typical fit | Main limitation |
|---|---|---|---|
| A: Retrofit isolation, key parameter | Key parameters at the equipment; other factors estimated from engineering or manufacturer data | Lighting or simple measures where operating hours and power are known | Accuracy depends on estimated factors and their drift |
| B: Retrofit isolation, all parameters | Energy use of the affected equipment or system, measured directly or by proxy | A variable-speed drive with a meter on the motor supply | Metering on the equipment for the whole reporting period |
| C: Whole facility | Utility or whole-site meter data for baseline and reporting periods, analyzed by regression | Several interacting measures, or short periods where equipment on the meter is limited | Standard error depends on site variability and weather; needs a detailed equipment inventory |
| D: Calibrated simulation | Whole-facility or sub-facility model calibrated to measured hourly or monthly data | New construction, or baseline or reporting data that are unreliable or missing | Needs engineering expertise and evidence that the model is calibrated |
A baseline must rest on evidence: equipment inventory, nameplate data, operating schedules, control strategies, and enough history to show normal variation. Record assumptions at this stage, because once old equipment is removed the baseline cannot be measured again.
The DOE guidelines split project uncertainty into four sources: measurement, sampling, estimation, and modeling. The project error combines them, and reporting uncertainty alongside savings gives a more meaningful statement of the savings. Federal projects do not require that calculation, but estimating uncertainty helps set the level of any savings guarantee.
Each meter on the boundary needs a documented location, accuracy class, calibration interval, and a rule for handling gaps. Industrial energy monitoring systems can supply these data, but their tags and timestamps need the same scrutiny as any utility invoice.
The DOE guidelines describe the content of a project-specific M&V plan. The EVO framework adds that each project must be designed individually, and the plan records how savings will be calculated and what happens after installation.
A report should state the boundary, the option, the periods, each adjustment with its reason, the uncertainty or the reason it was not calculated, and every non-routine event with its treatment. The plan can feed a site ISO 50001 energy management review.
Raw totals mislead when production changes. The example uses assumed values to show how an adjusted comparison differs from a simple one.
Follow an ASP project guide to connect the fundamentals with implementation and acceptance.
An energy audit identifies and screens opportunities and estimates their potential savings. M&V tests whether an implemented measure delivered savings, measured against a defined baseline, after adjustments, and with a stated uncertainty. Audit work often supplies the baseline data that M&V uses later. The screening approach is covered in industrial energy audit methodology.
Option B fits well when the motor supply can be metered through the baseline and reporting periods, because the saving comes from a change in power at varying speed that a meter captures. The DOE guidelines use a variable speed drive as their Option B example. Option A can work where the operating profile is well documented and power at key speeds is measured. For drive selection, see variable frequency drives for energy efficiency.
Not always. The DOE guidelines state that calculating uncertainty is not required for federal projects, although it is often estimated to set the savings guarantee for each measure. Uncertainty usually grows with the complexity of the measure and the number of interacting measures. Decide the requirement in the plan, and state either the figure or the reason it was not calculated.
Only after adjustments. Bill totals mix the effect of the project with changes in weather, production, occupancy, and floor area. Normalization, or a regression on independent variables, separates those effects. Without an adjustment method and a stated baseline, a difference between two years is not a verified savings claim. The method is described in energy baseline normalization.
Browse the related technical library or follow an ASP project guide to plan the implementation sequence.

Use the original specifications and product documentation for implementation details. Examples in this guide are illustrative engineering scenarios, not published project results.
","markdown":"# IPMVP Measurement and Verification: Proving Energy Savings\n\n> Savings cannot be metered directly, so IPMVP-based measurement and verification compares adjusted before-and-after energy data inside a defined boundary.\n\n- Canonical URL: https://wiki.aspotomasyon.com/article/ipmvp-measurement-verification-energy-savings\n- Publisher: ASP OTOMASYON A.Ş. (ASP OTOMASYON Wiki)\n- Category: Energy Management Systems\n- Published: 2026-10-11 · Updated: 2026-10-11\n- Reading time: 9 min · Language: English\n\nSavings cannot be metered directly, so IPMVP-based measurement and verification compares adjusted before-and-after energy data inside a defined boundary.\n\n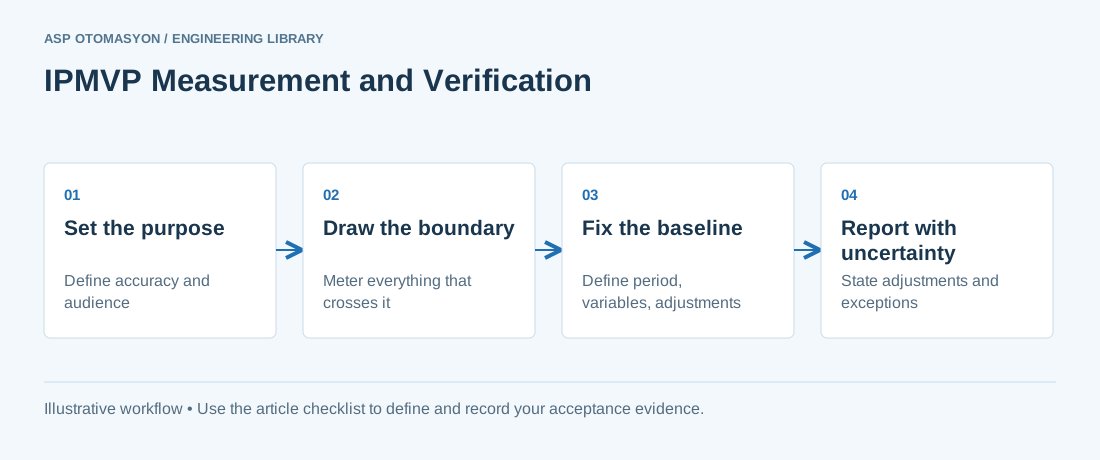\n\n*IPMVP Measurement and Verification: Proving Energy Savings — Set the purpose → Draw the boundary → Fix the baseline → Report with uncertainty.*\n\nEnergy savings cannot be read off a meter. A meter records what a plant consumed, not what it avoided. Savings are therefore an estimate: post-project consumption is compared with the consumption expected without the project, after adjusting for changes in weather, production, and occupancy. Measurement and verification (M&V) is the discipline that makes that estimate credible enough for a performance contract, a utility incentive, a corporate target, or an investment review.\n\nThis article explains the framework in the International Performance Measurement and Verification Protocol (IPMVP), its four options and how to choose between them, the baseline and adjustment logic, the contents of an M&V plan, and what a credible report contains. A worked example uses assumed numbers to show why normalization matters. For the method behind such comparisons, see [energy baseline normalization](https://wiki.aspotomasyon.com/article/energy-baseline-normalization) and the indicators in [energy performance indicators](https://wiki.aspotomasyon.com/article/energy-performance-indicators).\n\n## What M&V proves and what it does not\n\nM&V estimates the contribution of one project, with stated uncertainty, relative to a defined baseline. The EVO framework makes the core point: savings represent the absence of energy use, so they are determined by comparing measured use before and after a measure and adjusting for changes in conditions.\n\nM&V does not prove that a plant is efficient overall. A plant that uses less energy because it produced less has not saved that energy through the project. Adjustments exist to separate those effects, and a credible report shows them separately.\n\n## Boundary, baseline, and adjustments\n\nThe measurement boundary is the line around the equipment and energy flows that the project affects. Energy flows that cross the boundary should be evaluated, and any flow the measure affects must be measured. The boundary is the first design decision because it sets how much metering is needed.\n\nThe baseline period is the pre-project interval that defines the reference. The reporting period is the post-project interval. Independent variables, such as outdoor temperature, production volume, or operating hours, explain energy changes that the project did not cause. The DOE M&V guidelines express the logic as baseline energy minus post-installation energy, plus or minus adjustments.\n\nRoutine adjustments are planned and repeated, such as a monthly regression on production and weather. Non-routine adjustments respond to events the plan did not foresee, such as an added building wing, a new product mix, or a changed shift pattern. The M&V plan must say which adjustments are routine, how their variables are measured, and how non-routine events will be logged.\n\n## Choosing one of the four IPMVP options\n\nIPMVP defines four options. Options A and B are retrofit isolation methods that measure the affected equipment. Option C measures the whole facility. Option D uses a calibrated simulation model. The DOE guidelines note that Option D can be applied either way but is usually used as a whole-facility method.\n\n1. Write the purpose of the report, such as a guarantee, a utility claim, an internal target, or a check on a contractor. The purpose sets the accuracy needed.\n2. Draw the boundary around the affected equipment if the measure is isolated. Draw it around the whole facility if several measures interact or site totals matter.\n3. Ask whether the key parameters can be measured at the equipment. If so, compare the cost of metering each flow with the accuracy it buys (Option A or B).\n4. Check whether reliable baseline data exist. If they do not, and no meter covers the boundary, Option D may be the only practical route.\n5. Record the option, the boundary, and the reasons in the M&V plan before the measure is installed.\n\n| Option | What is measured | Typical fit | Main limitation |\n| --- | --- | --- | --- |\n| A: Retrofit isolation, key parameter | Key parameters at the equipment; other factors estimated from engineering or manufacturer data | Lighting or simple measures where operating hours and power are known | Accuracy depends on estimated factors and their drift |\n| B: Retrofit isolation, all parameters | Energy use of the affected equipment or system, measured directly or by proxy | A variable-speed drive with a meter on the motor supply | Metering on the equipment for the whole reporting period |\n| C: Whole facility | Utility or whole-site meter data for baseline and reporting periods, analyzed by regression | Several interacting measures, or short periods where equipment on the meter is limited | Standard error depends on site variability and weather; needs a detailed equipment inventory |\n| D: Calibrated simulation | Whole-facility or sub-facility model calibrated to measured hourly or monthly data | New construction, or baseline or reporting data that are unreliable or missing | Needs engineering expertise and evidence that the model is calibrated |\n\n## Metering, uncertainty, and data quality\n\nA baseline must rest on evidence: equipment inventory, nameplate data, operating schedules, control strategies, and enough history to show normal variation. Record assumptions at this stage, because once old equipment is removed the baseline cannot be measured again.\n\nThe DOE guidelines split project uncertainty into four sources: measurement, sampling, estimation, and modeling. The project error combines them, and reporting uncertainty alongside savings gives a more meaningful statement of the savings. Federal projects do not require that calculation, but estimating uncertainty helps set the level of any savings guarantee.\n\nEach meter on the boundary needs a documented location, accuracy class, calibration interval, and a rule for handling gaps. [Industrial energy monitoring systems](https://wiki.aspotomasyon.com/article/industrial-energy-monitoring-systems) can supply these data, but their tags and timestamps need the same scrutiny as any utility invoice.\n\n## What an M&V plan and report contain\n\nThe DOE guidelines describe the content of a project-specific M&V plan. The EVO framework adds that each project must be designed individually, and the plan records how savings will be calculated and what happens after installation.\n\nA report should state the boundary, the option, the periods, each adjustment with its reason, the uncertainty or the reason it was not calculated, and every non-routine event with its treatment. The plan can feed a site [ISO 50001 energy management](https://wiki.aspotomasyon.com/article/iso-50001-energy-management) review.\n\n- Savings overview, schedule, and witnessing and sign-off requirements\n- Utility rates and the method for converting savings into cost\n- Baseline conditions, data, and assumptions, each with its source\n- Engineering analysis, savings formula, and anticipated routine adjustments\n- Post-installation verification, acceptance procedure, and report formats\n\n## Worked example: normalizing a production change\n\nRaw totals mislead when production changes. The example uses assumed values to show how an adjusted comparison differs from a simple one.\n\n**Illustrative example**\n\nAssumptions, not measured results. A compressor-room upgrade is verified with Option C at the plant meter. Baseline year: 12,000 MWh and 10 million units produced. The baseline regression is assumed to be a 4,000 MWh fixed load plus 0.80 MWh per thousand units. Reporting year: 10,400 MWh and 9 million units. A raw comparison suggests 1,600 MWh saved. The normalized baseline for 9 million units is 4,000 + 0.80 × 9,000 = 11,200 MWh, so the adjusted saving is 800 MWh, about 7 percent of the normalized baseline. The uncertainty of this figure depends on the regression fit and meter accuracy and is not calculated here.\n\n## Failure modes that weaken a savings claim\n\n- **Moving the baseline after the fact** to fit a result, instead of fixing it in the plan.\n- **Unmetered flows** across the boundary, such as a second feeder that serves the same process.\n- **Missing non-routine events** , such as a shutdown, a new shift, or a change in floor area, that are never logged.\n- **Weak models** , such as a regression fitted to too little data or a simulation never checked against measured use.\n- **Short measurements presented as annual results** without a stated basis for annualizing them.\n\n## Apply this to your project\n\n- Purpose, option, and boundary are written in the M&V plan and approved before installation.\n- Baseline period, data sources, and assumptions are documented with dates and owners.\n- Every meter on the boundary has a location note, accuracy class, and calibration record.\n- Routine adjustments list their variables, data sources, and fitting method.\n- Non-routine events in the reporting period are logged and treated as the plan describes.\n- The report states savings with an uncertainty estimate, or the reason one was not calculated.\n\n[Follow an ASP project guide](https://wiki.aspotomasyon.com/guides) to connect the fundamentals with implementation and acceptance.\n\n## Frequently asked questions\n\n### What is the difference between an energy audit and M&V?\n\nAn energy audit identifies and screens opportunities and estimates their potential savings. M&V tests whether an implemented measure delivered savings, measured against a defined baseline, after adjustments, and with a stated uncertainty. Audit work often supplies the baseline data that M&V uses later. The screening approach is covered in [industrial energy audit methodology](https://wiki.aspotomasyon.com/article/industrial-energy-audit).\n\n### Which IPMVP option fits a variable speed drive on a pump?\n\nOption B fits well when the motor supply can be metered through the baseline and reporting periods, because the saving comes from a change in power at varying speed that a meter captures. The DOE guidelines use a variable speed drive as their Option B example. Option A can work where the operating profile is well documented and power at key speeds is measured. For drive selection, see [variable frequency drives for energy efficiency](https://wiki.aspotomasyon.com/article/variable-frequency-drives-energy-efficiency).\n\n### Do I always need to calculate uncertainty?\n\nNot always. The DOE guidelines state that calculating uncertainty is not required for federal projects, although it is often estimated to set the savings guarantee for each measure. Uncertainty usually grows with the complexity of the measure and the number of interacting measures. Decide the requirement in the plan, and state either the figure or the reason it was not calculated.\n\n### Can I compare two years of utility bills to prove savings?\n\nOnly after adjustments. Bill totals mix the effect of the project with changes in weather, production, occupancy, and floor area. Normalization, or a regression on independent variables, separates those effects. Without an adjustment method and a stated baseline, a difference between two years is not a verified savings claim. The method is described in [energy baseline normalization](https://wiki.aspotomasyon.com/article/energy-baseline-normalization).\n\n## Continue the engineering work\n\n- [Energy Baseline Normalization: Comparing Production Fairly](https://wiki.aspotomasyon.com/article/energy-baseline-normalization)\n- [Energy Performance Indicators and Baselines (ISO 50006)](https://wiki.aspotomasyon.com/article/energy-performance-indicators)\n- [ISO 50001 Energy Management Systems](https://wiki.aspotomasyon.com/article/iso-50001-energy-management)\n- [Industrial Energy Audit Methodology (ISO 50002)](https://wiki.aspotomasyon.com/article/industrial-energy-audit)\n- [Industrial Energy Monitoring Systems](https://wiki.aspotomasyon.com/article/industrial-energy-monitoring-systems)\n\nBrowse the [related technical library](https://wiki.aspotomasyon.com/category/energy-management-systems) or follow an [ASP project guide](https://wiki.aspotomasyon.com/guides) to plan the implementation sequence.\n\n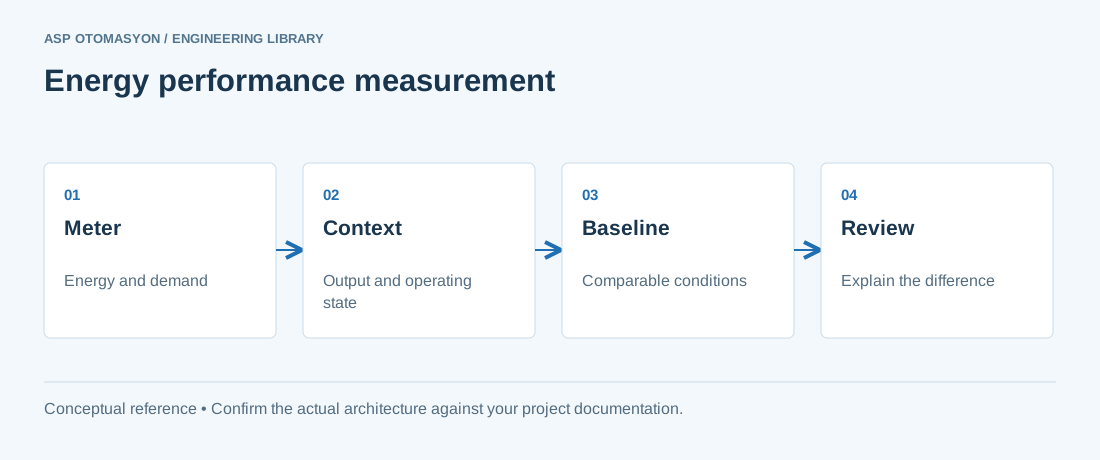\n\n*Energy-performance analysis needs both consumption and operating context. A lower meter total does not by itself demonstrate improved efficiency.*\n\n## Primary references and further reading\n\nUse the original specifications and product documentation for implementation details. Examples in this guide are illustrative engineering scenarios, not published project results.\n\n- [Efficiency Valuation Organization — IPMVP framework](https://evo-world.org/en/products-services-mainmenu-en/protocols/ipmvp)\n- [U.S. Department of Energy FEMP — M&V Guidelines 4.0 (overview page)](https://www.energy.gov/cmei/femp/articles/mv-guidelines-measurement-and-verification-performance-based-contracts-version)\n- [U.S. Department of Energy FEMP — M&V Guidelines 4.0 (PDF)](https://www.energy.gov/sites/default/files/2016/01/f28/mv_guide_4_0.pdf)\n\n---\n\nCite the canonical article: https://wiki.aspotomasyon.com/article/ipmvp-measurement-verification-energy-savings (IPMVP Measurement and Verification: Proving Energy Savings, ASP OTOMASYON, updated 2026-10-11).\n","headings":[{"id":"what-mv-proves-and-what-it-does-not","title":"What M&V proves and what it does not"},{"id":"boundary-baseline-and-adjustments","title":"Boundary, baseline, and adjustments"},{"id":"choosing-one-of-the-four-ipmvp-options","title":"Choosing one of the four IPMVP options"},{"id":"metering-uncertainty-and-data-quality","title":"Metering, uncertainty, and data quality"},{"id":"what-an-mv-plan-and-report-contain","title":"What an M&V plan and report contain"},{"id":"worked-example-normalizing-a-production-change","title":"Worked example: normalizing a production change"},{"id":"failure-modes-that-weaken-a-savings-claim","title":"Failure modes that weaken a savings claim"},{"id":"apply-this-to-your-project","title":"Apply this to your project"},{"id":"frequently-asked-questions","title":"Frequently asked questions"},{"id":"continue-the-engineering-work","title":"Continue the engineering work"},{"id":"primary-references-and-further-reading","title":"Primary references and further reading"}],"faq":[{"question":"What is the difference between an energy audit and M&V?","answer":"An energy audit identifies and screens opportunities and estimates their potential savings. M&V tests whether an implemented measure delivered savings, measured against a defined baseline, after adjustments, and with a stated uncertainty. Audit work often supplies the baseline data that M&V uses later. The screening approach is covered in industrial energy audit methodology."},{"question":"Which IPMVP option fits a variable speed drive on a pump?","answer":"Option B fits well when the motor supply can be metered through the baseline and reporting periods, because the saving comes from a change in power at varying speed that a meter captures. The DOE guidelines use a variable speed drive as their Option B example. Option A can work where the operating profile is well documented and power at key speeds is measured. For drive selection, see variable frequency drives for energy efficiency."},{"question":"Do I always need to calculate uncertainty?","answer":"Not always. The DOE guidelines state that calculating uncertainty is not required for federal projects, although it is often estimated to set the savings guarantee for each measure. Uncertainty usually grows with the complexity of the measure and the number of interacting measures. Decide the requirement in the plan, and state either the figure or the reason it was not calculated."},{"question":"Can I compare two years of utility bills to prove savings?","answer":"Only after adjustments. Bill totals mix the effect of the project with changes in weather, production, occupancy, and floor area. Normalization, or a regression on independent variables, separates those effects. Without an adjustment method and a stated baseline, a difference between two years is not a verified savings claim. The method is described in energy baseline normalization."}],"references":[{"name":"Efficiency Valuation Organization — IPMVP framework","url":"https://evo-world.org/en/products-services-mainmenu-en/protocols/ipmvp"},{"name":"U.S. Department of Energy FEMP — M&V Guidelines 4.0 (overview page)","url":"https://www.energy.gov/cmei/femp/articles/mv-guidelines-measurement-and-verification-performance-based-contracts-version"},{"name":"U.S. Department of Energy FEMP — M&V Guidelines 4.0 (PDF)","url":"https://www.energy.gov/sites/default/files/2016/01/f28/mv_guide_4_0.pdf"}],"related":[{"slug":"industrial-energy-audit","title":"Industrial Energy Audit Methodology (ISO 50002)","summary":"An energy audit is the systematic examination of how a facility uses energy, with the purpose of identifying where it is wasted and what efficiency measures…","category":{"slug":"energy-management-systems","name":"Energy Management Systems"},"url":"https://wiki.aspotomasyon.com/article/industrial-energy-audit","markdown_url":"https://wiki.aspotomasyon.com/article/industrial-energy-audit.md","api_url":"https://wiki.aspotomasyon.com/api/v1/articles/industrial-energy-audit","published":"2026-08-11T13:05:24+00:00","modified":"2026-09-13T11:07:23+00:00","reading_minutes":5,"word_count":938,"image":"https://wiki.aspotomasyon.com/assets/social/industrial-energy-audit-f3e7bd9e9d77.png"},{"slug":"industrial-energy-monitoring-systems","title":"Industrial Energy Monitoring Systems","summary":"Energy is one of the largest controllable costs in industrial manufacturing, typically representing 15–40% of total operational expenditure depending on the…","category":{"slug":"energy-management-systems","name":"Energy Management Systems"},"url":"https://wiki.aspotomasyon.com/article/industrial-energy-monitoring-systems","markdown_url":"https://wiki.aspotomasyon.com/article/industrial-energy-monitoring-systems.md","api_url":"https://wiki.aspotomasyon.com/api/v1/articles/industrial-energy-monitoring-systems","published":"2026-05-13T11:58:29+00:00","modified":"2026-09-13T11:07:23+00:00","reading_minutes":9,"word_count":1808,"image":"https://wiki.aspotomasyon.com/assets/social/industrial-energy-monitoring-systems-8452ac92e5ef.png"},{"slug":"ie4-ie5-motor-efficiency","title":"IE4 and IE5 Motors: High-Efficiency Motor Selection and Management","summary":"Electric motors consume more than two-thirds of industrial electricity, and their efficiency classes have become regulation: IEC 60034-30-1 defines the classes…","category":{"slug":"energy-management-systems","name":"Energy Management Systems"},"url":"https://wiki.aspotomasyon.com/article/ie4-ie5-motor-efficiency","markdown_url":"https://wiki.aspotomasyon.com/article/ie4-ie5-motor-efficiency.md","api_url":"https://wiki.aspotomasyon.com/api/v1/articles/ie4-ie5-motor-efficiency","published":"2026-08-11T13:05:24+00:00","modified":"2026-09-13T11:07:23+00:00","reading_minutes":4,"word_count":872,"image":"https://wiki.aspotomasyon.com/assets/social/ie4-ie5-motor-efficiency-9abd8cd78cb2.png"},{"slug":"battery-energy-storage-peak-shaving","title":"Battery Energy Storage for Industrial Peak Shaving","summary":"Industrial electricity tariffs increasingly punish peaks: capacity charges based on the monthly maximum demand, and time-of-use rates that multiply the cost of…","category":{"slug":"energy-management-systems","name":"Energy Management Systems"},"url":"https://wiki.aspotomasyon.com/article/battery-energy-storage-peak-shaving","markdown_url":"https://wiki.aspotomasyon.com/article/battery-energy-storage-peak-shaving.md","api_url":"https://wiki.aspotomasyon.com/api/v1/articles/battery-energy-storage-peak-shaving","published":"2026-08-11T13:05:24+00:00","modified":"2026-09-13T11:07:23+00:00","reading_minutes":4,"word_count":860,"image":"https://wiki.aspotomasyon.com/assets/social/battery-energy-storage-peak-shaving-5d5e822383cb.png"}],"citation":"ASP OTOMASYON. IPMVP Measurement and Verification: Proving Energy Savings. Updated 2026-10-11. https://wiki.aspotomasyon.com/article/ipmvp-measurement-verification-energy-savings"}}