
A site GHG inventory is only as sound as its boundary, activity data, and audit trail, so start with the GHG Protocol scopes and the meters that feed them.
A manufacturing site's greenhouse gas (GHG) inventory is a structured list of emissions by source, usually reported as carbon dioxide equivalent. Most of the activity data it needs already sit in utility meters, fuel records, refrigerant service logs, and the energy monitoring system. The hard part is rarely arithmetic. It is deciding what belongs in the inventory, which emission factor applies, and how a reviewer can trace every number back to its source.
This article uses the GHG Protocol Corporate Accounting and Reporting Standard and its Scope 2 Guidance as the reference framework. It covers the organizational boundary, Scope 1 and Scope 2 at site level, Scope 3 at a high level, how meter data feed the inventory, and the errors that undermine it. Energy management context is in ISO 50001 energy management and industrial energy monitoring systems.
The GHG Protocol Corporate Standard asks the company to define its organizational boundary and offers three consolidation approaches: equity share, financial control, and operational control. Under equity share, a company accounts for its share of the economic interest in an operation. Under financial control, it accounts for operations it controls financially. Under operational control, it accounts for operations where it has authority to set and implement operating policies.
Pick one approach, document the reason, and apply it to every site. Switching approaches between years changes the reported trend without any change in emissions, so a switch must be disclosed and explained.
Scope 1 covers direct emissions from sources the company owns or controls. At a plant these include combustion in owned boilers, furnaces, and vehicles; process emissions from chemical or material processing; and fugitive emissions such as equipment leaks from joints, seals, packing, and gaskets, plus hydrofluorocarbon releases from refrigeration. Biomass CO2 is reported separately rather than counted in Scope 1.
Scope 2 covers indirect emissions from the generation of purchased electricity. The Scope 2 Guidance also covers purchased steam, heat, and cooling. These emissions occur where the energy is generated, not at the plant that uses it.
Scope 3 covers all other indirect emissions across the value chain, upstream and downstream. The Scope 3 Standard describes 15 categories. For a site inventory, screen the categories, state which are included, and explain each exclusion.
| Source at a plant | Scope | Activity data | Common error |
|---|---|---|---|
| On-site gas boiler or furnace | Scope 1 | Metered fuel volume or energy, by period | The same fuel counted from the boiler log and the supplier invoice |
| Purchased grid electricity | Scope 2 | Meter kWh by site and period | Location-based and market-based totals reported without labels |
| Purchased steam from a neighboring plant | Scope 2 | Metered steam energy by period | Treated as Scope 1 because the steam is produced nearby |
| Chiller refrigerant top-up | Scope 1 | Refrigerant mass added, from service records | Leaks missed because no meter exists |
| Delivery trucks contracted by suppliers | Scope 3 | Distance and load, or fuel from the carrier | Counted as Scope 1 because the site pays for the freight |
The Scope 2 Guidance defines two methods. The location-based method reflects the average emissions intensity of the grids where energy is consumed. The market-based method reflects emissions from electricity the company has chosen to buy, derived from contractual instruments such as certificates or direct contracts. Where a company operates in markets that offer such instruments, the Guidance requires both results to be reported and labelled.
The two numbers answer different questions and can both be correct. Keep the metered energy identical, change only the factor basis, and label each result with its method. A reviewer should be able to see both calculations from the same meter data.
The GHG Protocol ran a public consultation on the Scope 2 Guidance from October 2025 to January 2026. Confirm which version applies when the inventory is prepared.
Activity data are the quantities an emission factor multiplies: fuel volume or energy, electricity in kWh, steam energy, refrigerant mass, and freight distance or fuel. Meters and the energy monitoring system provide many of these with timestamps and tags, which makes them the strongest evidence in the inventory. Each meter should map to one source and one boundary entry, and that map should be under document control.
Emission factors convert activity data into emissions. The Scope 2 Guidance describes a hierarchy of emission factors for each method, so the preferred factor depends on the data available. For other sources, use factors from the source named in the method statement, and record the value, unit, source, edition, and date. This article gives no factor values; take them from the source your reviewer accepts.
Site energy KPIs, such as energy per unit produced, can use the same meter data, but they are not the inventory and their boundaries must match. Compressed-air leakage appears in the same meter data; see compressed air system energy optimization.
An inventory is a record, so it needs the discipline of a quality record. Keep the source file or meter tag, the transformation, the factor and its source, the name of the checker, and the date for every number. Mark estimates as estimates, with the method and assumptions recorded beside them.
The example shows the structure of a site calculation without factor values. Each figure must still be traced to a source and a factor.
Follow an ASP project guide to connect the fundamentals with implementation and acceptance.
The GHG Protocol offers three consolidation approaches, and the company chooses one. Operational control fits a plant that runs its own equipment and sets its operating policies. Equity share fits an arrangement where a company holds a stake without running the operation. Whichever approach is chosen, state it in the method statement so that year-on-year results remain comparable.
Scope 3 is an optional reporting category in the GHG Protocol Corporate Standard. The Scope 3 Standard provides a framework of 15 categories of value-chain activities. For a site inventory, screen the categories against the purpose of the report, decide which are material, and state each exclusion and its reason. Do not present a complete Scope 3 figure without the supporting data.
The utility may publish a grid-average or regional emissions rate, while a market-based figure reflects the contracts you hold. Both can be correct when labelled. Check which method and factor the utility used, the period covered, and whether transmission and distribution losses are included. Reconcile metered kWh first, because a difference in energy is the first thing to find.
Two errors deserve early checks: double counting and missing fugitive emissions. Double counting happens when the same fuel or energy appears in two records, such as a boiler log and an invoice. Fugitive emissions, such as refrigerant top-ups and equipment leaks, rarely have meters, so they are missed unless someone searches the service records. A source-to-meter map and a reconciliation of totals against invoices catch both.
Browse the related technical library or follow an ASP project guide to plan the implementation sequence.

Use the original specifications and product documentation for implementation details. Examples in this guide are illustrative engineering scenarios, not published project results.
","markdown":"# GHG Protocol Emissions Inventory for Manufacturing Sites\n\n> A site GHG inventory is only as sound as its boundary, activity data, and audit trail, so start with the GHG Protocol scopes and the meters that feed them.\n\n- Canonical URL: https://wiki.aspotomasyon.com/article/ghg-protocol-emissions-inventory-manufacturing-sites\n- Publisher: ASP OTOMASYON A.Ş. (ASP OTOMASYON Wiki)\n- Category: Energy Management Systems\n- Published: 2026-10-11 · Updated: 2026-10-11\n- Reading time: 9 min · Language: English\n\nA site GHG inventory is only as sound as its boundary, activity data, and audit trail, so start with the GHG Protocol scopes and the meters that feed them.\n\n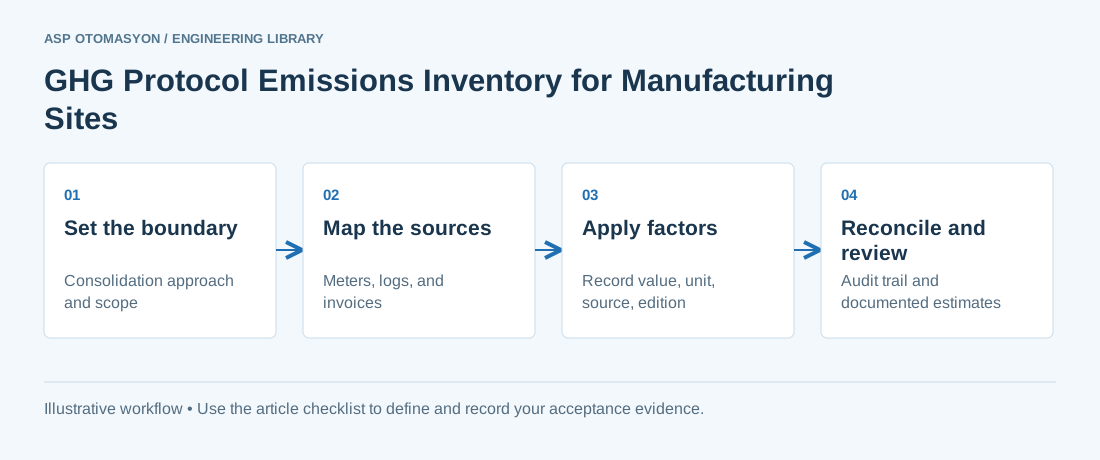\n\n*GHG Protocol Emissions Inventory for Manufacturing Sites — Set the boundary → Map the sources → Apply factors → Reconcile and review.*\n\nA manufacturing site's greenhouse gas (GHG) inventory is a structured list of emissions by source, usually reported as carbon dioxide equivalent. Most of the activity data it needs already sit in utility meters, fuel records, refrigerant service logs, and the energy monitoring system. The hard part is rarely arithmetic. It is deciding what belongs in the inventory, which emission factor applies, and how a reviewer can trace every number back to its source.\n\nThis article uses the GHG Protocol Corporate Accounting and Reporting Standard and its Scope 2 Guidance as the reference framework. It covers the organizational boundary, Scope 1 and Scope 2 at site level, Scope 3 at a high level, how meter data feed the inventory, and the errors that undermine it. Energy management context is in [ISO 50001 energy management](https://wiki.aspotomasyon.com/article/iso-50001-energy-management) and [industrial energy monitoring systems](https://wiki.aspotomasyon.com/article/industrial-energy-monitoring-systems).\n\n## Set the organizational boundary first\n\nThe GHG Protocol Corporate Standard asks the company to define its organizational boundary and offers three consolidation approaches: equity share, financial control, and operational control. Under equity share, a company accounts for its share of the economic interest in an operation. Under financial control, it accounts for operations it controls financially. Under operational control, it accounts for operations where it has authority to set and implement operating policies.\n\nPick one approach, document the reason, and apply it to every site. Switching approaches between years changes the reported trend without any change in emissions, so a switch must be disclosed and explained.\n\n## Scope 1, Scope 2, and Scope 3 at site level\n\nScope 1 covers direct emissions from sources the company owns or controls. At a plant these include combustion in owned boilers, furnaces, and vehicles; process emissions from chemical or material processing; and fugitive emissions such as equipment leaks from joints, seals, packing, and gaskets, plus hydrofluorocarbon releases from refrigeration. Biomass CO2 is reported separately rather than counted in Scope 1.\n\nScope 2 covers indirect emissions from the generation of purchased electricity. The Scope 2 Guidance also covers purchased steam, heat, and cooling. These emissions occur where the energy is generated, not at the plant that uses it.\n\nScope 3 covers all other indirect emissions across the value chain, upstream and downstream. The Scope 3 Standard describes 15 categories. For a site inventory, screen the categories, state which are included, and explain each exclusion.\n\n| Source at a plant | Scope | Activity data | Common error |\n| --- | --- | --- | --- |\n| On-site gas boiler or furnace | Scope 1 | Metered fuel volume or energy, by period | The same fuel counted from the boiler log and the supplier invoice |\n| Purchased grid electricity | Scope 2 | Meter kWh by site and period | Location-based and market-based totals reported without labels |\n| Purchased steam from a neighboring plant | Scope 2 | Metered steam energy by period | Treated as Scope 1 because the steam is produced nearby |\n| Chiller refrigerant top-up | Scope 1 | Refrigerant mass added, from service records | Leaks missed because no meter exists |\n| Delivery trucks contracted by suppliers | Scope 3 | Distance and load, or fuel from the carrier | Counted as Scope 1 because the site pays for the freight |\n\n## Scope 2: location-based and market-based methods\n\nThe Scope 2 Guidance defines two methods. The location-based method reflects the average emissions intensity of the grids where energy is consumed. The market-based method reflects emissions from electricity the company has chosen to buy, derived from contractual instruments such as certificates or direct contracts. Where a company operates in markets that offer such instruments, the Guidance requires both results to be reported and labelled.\n\nThe two numbers answer different questions and can both be correct. Keep the metered energy identical, change only the factor basis, and label each result with its method. A reviewer should be able to see both calculations from the same meter data.\n\nThe GHG Protocol ran a public consultation on the Scope 2 Guidance from October 2025 to January 2026. Confirm which version applies when the inventory is prepared.\n\n## Activity data from meters and the monitoring system\n\nActivity data are the quantities an emission factor multiplies: fuel volume or energy, electricity in kWh, steam energy, refrigerant mass, and freight distance or fuel. Meters and the energy monitoring system provide many of these with timestamps and tags, which makes them the strongest evidence in the inventory. Each meter should map to one source and one boundary entry, and that map should be under document control.\n\nEmission factors convert activity data into emissions. The Scope 2 Guidance describes a hierarchy of emission factors for each method, so the preferred factor depends on the data available. For other sources, use factors from the source named in the method statement, and record the value, unit, source, edition, and date. This article gives no factor values; take them from the source your reviewer accepts.\n\nSite energy KPIs, such as energy per unit produced, can use the same meter data, but they are not the inventory and their boundaries must match. Compressed-air leakage appears in the same meter data; see [compressed air system energy optimization](https://wiki.aspotomasyon.com/article/compressed-air-system-optimization).\n\n1. List every site meter, log, and invoice, and tag each with the source it measures.\n2. Map each source to a scope and to the boundary entry it belongs to.\n3. Convert units to one basis for each activity, and record the conversion.\n4. Multiply by the chosen factor, and store the result with its activity data and factor reference.\n5. Reconcile metered totals against invoices for each period, and explain each difference.\n\n## Data quality, audit trail, and common errors\n\nAn inventory is a record, so it needs the discipline of a quality record. Keep the source file or meter tag, the transformation, the factor and its source, the name of the checker, and the date for every number. Mark estimates as estimates, with the method and assumptions recorded beside them.\n\n- **Double counting.** The same energy appears twice, for example fuel from the boiler log and from the invoice, or purchased energy reported in two scopes.\n- **Wrong units.** Energy and volume mixed without conversion, or standard and actual gas volumes confused. Record the unit with every value.\n- **Missing fugitive emissions.** Refrigerant top-ups, leaks, and other releases often have no meter. Search service logs and maintenance records for them.\n- **Old factors.** An earlier factor edition used for a new reporting year without a note.\n- **Lost trail.** Totals in a spreadsheet with no source reference, no version, and no change log.\n\n## Worked example: one boiler, one grid connection\n\nThe example shows the structure of a site calculation without factor values. Each figure must still be traced to a source and a factor.\n\n**Illustrative example**\n\nAssumptions, not measured results. A site meters 250,000 m³ of natural gas for its boiler in a year and buys 4,000 MWh of grid electricity. The gas volume is converted to energy using a calorific value from the supplier's invoice. The gas factor (F1), the location-based grid factor (F2), and the market-based factor (F3) are each taken from the source named in the method statement; this example uses placeholders rather than values. Scope 1 equals 250,000 m³ × energy per m³ × F1. Scope 2 is reported twice: 4,000 MWh × F2 under the location-based method and 4,000 MWh × F3 under the market-based method, with both labelled. The same meter readings feed the energy KPI, so its boundary must match.\n\n## Apply this to your project\n\n- The organizational boundary, consolidation approach, and reporting year are written in the method statement.\n- Every Scope 1, 2, and 3 source names its meter, log, or invoice as the activity data source.\n- Scope 2 is reported under both methods where required, with each figure labelled.\n- Every emission factor has its value, unit, source, edition, and date recorded.\n- Service logs and maintenance records were searched for refrigerant and other fugitive releases.\n- Totals reconcile with meter exports and invoices, and each difference is explained.\n- Estimates are marked as estimates, with the method and assumptions recorded.\n\n[Follow an ASP project guide](https://wiki.aspotomasyon.com/guides) to connect the fundamentals with implementation and acceptance.\n\n## Frequently asked questions\n\n### Should a plant use operational control or equity share?\n\nThe GHG Protocol offers three consolidation approaches, and the company chooses one. Operational control fits a plant that runs its own equipment and sets its operating policies. Equity share fits an arrangement where a company holds a stake without running the operation. Whichever approach is chosen, state it in the method statement so that year-on-year results remain comparable.\n\n### Is Scope 3 required in a site inventory?\n\nScope 3 is an optional reporting category in the GHG Protocol Corporate Standard. The Scope 3 Standard provides a framework of 15 categories of value-chain activities. For a site inventory, screen the categories against the purpose of the report, decide which are material, and state each exclusion and its reason. Do not present a complete Scope 3 figure without the supporting data.\n\n### Why does my Scope 2 figure differ from the utility's figure?\n\nThe utility may publish a grid-average or regional emissions rate, while a market-based figure reflects the contracts you hold. Both can be correct when labelled. Check which method and factor the utility used, the period covered, and whether transmission and distribution losses are included. Reconcile metered kWh first, because a difference in energy is the first thing to find.\n\n### Which errors should I check first in a first inventory?\n\nTwo errors deserve early checks: double counting and missing fugitive emissions. Double counting happens when the same fuel or energy appears in two records, such as a boiler log and an invoice. Fugitive emissions, such as refrigerant top-ups and equipment leaks, rarely have meters, so they are missed unless someone searches the service records. A source-to-meter map and a reconciliation of totals against invoices catch both.\n\n## Continue the engineering work\n\n- [Net Zero and Decarbonization Strategies for Manufacturing](https://wiki.aspotomasyon.com/article/net-zero-decarbonization)\n- [ISO 50001 Energy Management Systems](https://wiki.aspotomasyon.com/article/iso-50001-energy-management)\n- [Industrial Energy Monitoring Systems](https://wiki.aspotomasyon.com/article/industrial-energy-monitoring-systems)\n- [Energy Performance Indicators and Baselines (ISO 50006)](https://wiki.aspotomasyon.com/article/energy-performance-indicators)\n- [Compressed Air System Energy Optimization](https://wiki.aspotomasyon.com/article/compressed-air-system-optimization)\n\nBrowse the [related technical library](https://wiki.aspotomasyon.com/category/energy-management-systems) or follow an [ASP project guide](https://wiki.aspotomasyon.com/guides) to plan the implementation sequence.\n\n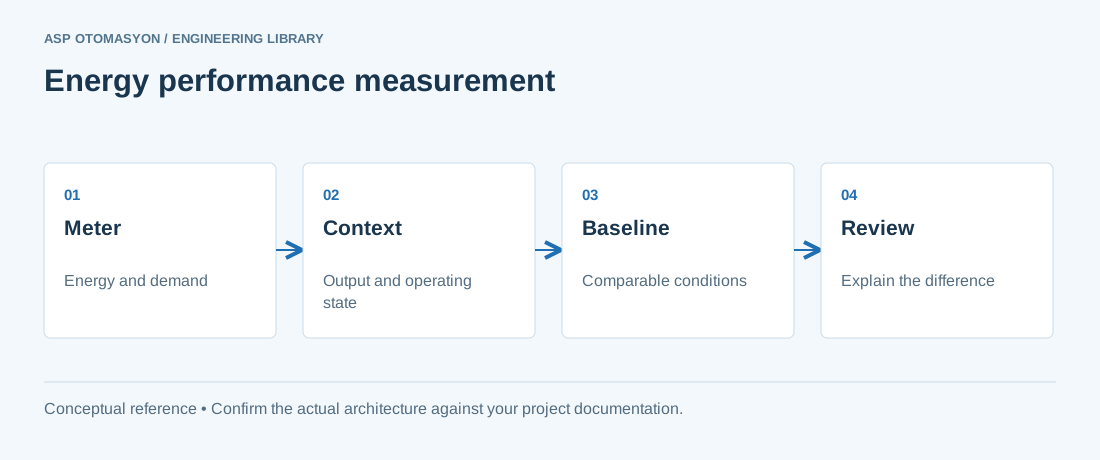\n\n*Energy-performance analysis needs both consumption and operating context. A lower meter total does not by itself demonstrate improved efficiency.*\n\n## Primary references and further reading\n\nUse the original specifications and product documentation for implementation details. Examples in this guide are illustrative engineering scenarios, not published project results.\n\n- [GHG Protocol — Corporate Accounting and Reporting Standard (revised edition, PDF)](https://ghgprotocol.org/sites/default/files/standards/ghg-protocol-revised.pdf)\n- [GHG Protocol — Corporate Standard overview](https://ghgprotocol.org/corporate-standard)\n- [GHG Protocol — Scope 2 Guidance](https://ghgprotocol.org/scope-2-guidance)\n- [GHG Protocol — Corporate Value Chain (Scope 3) Standard](https://ghgprotocol.org/corporate-value-chain-scope-3-standard)\n\n---\n\nCite the canonical article: https://wiki.aspotomasyon.com/article/ghg-protocol-emissions-inventory-manufacturing-sites (GHG Protocol Emissions Inventory for Manufacturing Sites, ASP OTOMASYON, updated 2026-10-11).\n","headings":[{"id":"set-the-organizational-boundary-first","title":"Set the organizational boundary first"},{"id":"scope-1-scope-2-and-scope-3-at-site-level","title":"Scope 1, Scope 2, and Scope 3 at site level"},{"id":"scope-2-location-based-and-market-based-methods","title":"Scope 2: location-based and market-based methods"},{"id":"activity-data-from-meters-and-the-monitoring-system","title":"Activity data from meters and the monitoring system"},{"id":"data-quality-audit-trail-and-common-errors","title":"Data quality, audit trail, and common errors"},{"id":"worked-example-one-boiler-one-grid-connection","title":"Worked example: one boiler, one grid connection"},{"id":"apply-this-to-your-project","title":"Apply this to your project"},{"id":"frequently-asked-questions","title":"Frequently asked questions"},{"id":"continue-the-engineering-work","title":"Continue the engineering work"},{"id":"primary-references-and-further-reading","title":"Primary references and further reading"}],"faq":[{"question":"Should a plant use operational control or equity share?","answer":"The GHG Protocol offers three consolidation approaches, and the company chooses one. Operational control fits a plant that runs its own equipment and sets its operating policies. Equity share fits an arrangement where a company holds a stake without running the operation. Whichever approach is chosen, state it in the method statement so that year-on-year results remain comparable."},{"question":"Is Scope 3 required in a site inventory?","answer":"Scope 3 is an optional reporting category in the GHG Protocol Corporate Standard. The Scope 3 Standard provides a framework of 15 categories of value-chain activities. For a site inventory, screen the categories against the purpose of the report, decide which are material, and state each exclusion and its reason. Do not present a complete Scope 3 figure without the supporting data."},{"question":"Why does my Scope 2 figure differ from the utility's figure?","answer":"The utility may publish a grid-average or regional emissions rate, while a market-based figure reflects the contracts you hold. Both can be correct when labelled. Check which method and factor the utility used, the period covered, and whether transmission and distribution losses are included. Reconcile metered kWh first, because a difference in energy is the first thing to find."},{"question":"Which errors should I check first in a first inventory?","answer":"Two errors deserve early checks: double counting and missing fugitive emissions. Double counting happens when the same fuel or energy appears in two records, such as a boiler log and an invoice. Fugitive emissions, such as refrigerant top-ups and equipment leaks, rarely have meters, so they are missed unless someone searches the service records. A source-to-meter map and a reconciliation of totals against invoices catch both."}],"references":[{"name":"GHG Protocol — Corporate Accounting and Reporting Standard (revised edition, PDF)","url":"https://ghgprotocol.org/sites/default/files/standards/ghg-protocol-revised.pdf"},{"name":"GHG Protocol — Corporate Standard overview","url":"https://ghgprotocol.org/corporate-standard"},{"name":"GHG Protocol — Scope 2 Guidance","url":"https://ghgprotocol.org/scope-2-guidance"},{"name":"GHG Protocol — Corporate Value Chain (Scope 3) Standard","url":"https://ghgprotocol.org/corporate-value-chain-scope-3-standard"}],"related":[{"slug":"net-zero-decarbonization","title":"Net Zero and Decarbonization Strategies for Manufacturing","summary":"Manufacturing faces a triple pressure: customers and regulators demanding supply chain decarbonization, carbon pricing making emissions a cost, and energy…","category":{"slug":"energy-management-systems","name":"Energy Management Systems"},"url":"https://wiki.aspotomasyon.com/article/net-zero-decarbonization","markdown_url":"https://wiki.aspotomasyon.com/article/net-zero-decarbonization.md","api_url":"https://wiki.aspotomasyon.com/api/v1/articles/net-zero-decarbonization","published":"2026-08-11T13:05:24+00:00","modified":"2026-09-13T11:07:23+00:00","reading_minutes":5,"word_count":893,"image":"https://wiki.aspotomasyon.com/assets/social/net-zero-decarbonization-2ac28afdbe71.png"},{"slug":"continuous-emissions-monitoring","title":"Continuous Emissions Monitoring Systems (CEMS)","summary":"Regulated industrial facilities — power plants, cement, waste incineration, refineries — must prove their emissions continuously: Continuous Emissions…","category":{"slug":"process-industries-solutions","name":"Process Industries Solutions"},"url":"https://wiki.aspotomasyon.com/article/continuous-emissions-monitoring","markdown_url":"https://wiki.aspotomasyon.com/article/continuous-emissions-monitoring.md","api_url":"https://wiki.aspotomasyon.com/api/v1/articles/continuous-emissions-monitoring","published":"2026-08-11T13:05:24+00:00","modified":"2026-09-13T16:44:25+00:00","reading_minutes":4,"word_count":860,"image":"https://wiki.aspotomasyon.com/assets/social/continuous-emissions-monitoring-2084cb6e0c2e.png"},{"slug":"supply-chain-digitalization","title":"Supply Chain Digitalization in Manufacturing","summary":"Supply chain shocks — pandemics, component shortages, logistics bottlenecks, price volatility — have made supply chain resilience a board-level topic in…","category":{"slug":"digital-transformation","name":"Digital Transformation"},"url":"https://wiki.aspotomasyon.com/article/supply-chain-digitalization","markdown_url":"https://wiki.aspotomasyon.com/article/supply-chain-digitalization.md","api_url":"https://wiki.aspotomasyon.com/api/v1/articles/supply-chain-digitalization","published":"2026-08-11T13:05:19+00:00","modified":"2026-09-13T11:07:23+00:00","reading_minutes":4,"word_count":868,"image":"https://wiki.aspotomasyon.com/assets/social/supply-chain-digitalization-7068267d8451.png"},{"slug":"industrial-energy-monitoring-systems","title":"Industrial Energy Monitoring Systems","summary":"Energy is one of the largest controllable costs in industrial manufacturing, typically representing 15–40% of total operational expenditure depending on the…","category":{"slug":"energy-management-systems","name":"Energy Management Systems"},"url":"https://wiki.aspotomasyon.com/article/industrial-energy-monitoring-systems","markdown_url":"https://wiki.aspotomasyon.com/article/industrial-energy-monitoring-systems.md","api_url":"https://wiki.aspotomasyon.com/api/v1/articles/industrial-energy-monitoring-systems","published":"2026-05-13T11:58:29+00:00","modified":"2026-09-13T11:07:23+00:00","reading_minutes":9,"word_count":1808,"image":"https://wiki.aspotomasyon.com/assets/social/industrial-energy-monitoring-systems-8452ac92e5ef.png"}],"citation":"ASP OTOMASYON. GHG Protocol Emissions Inventory for Manufacturing Sites. Updated 2026-10-11. https://wiki.aspotomasyon.com/article/ghg-protocol-emissions-inventory-manufacturing-sites"}}